@cbb77: I have taken a look at the fan reading problem. There is a small chance that the values are encoded in the Bank 6 and Bank 7 values of the w83667hgb chip. But I do not have any documentation about it, and can't figure out anything that would match the values on your screenshot.
Navigation
Install the app
How to install the app on iOS
Follow along with the video below to see how to install our site as a web app on your home screen.
Note: This feature may not be available in some browsers.
More options
You are using an out of date browser. It may not display this or other websites correctly.
You should upgrade or use an alternative browser.
You should upgrade or use an alternative browser.
Open Hardware Monitor
- Thread starter mmoeller
- Start date
@mmoeller
Regarding the fan issue, does the chip have to be setup prior to giving the RPM. Its odd that the usual regs are all FF, the Bank 6 registers for SYSFANIN etc dont look meaningfull and in the datasheet bank 7 is reserved. Maybe get an output of the regs start up asus probe then regs again see if they change much, maybe slow a fan down or pull it and see what changes")
Regarding the fan issue, does the chip have to be setup prior to giving the RPM. Its odd that the usual regs are all FF, the Bank 6 registers for SYSFANIN etc dont look meaningfull and in the datasheet bank 7 is reserved. Maybe get an output of the regs start up asus probe then regs again see if they change much, maybe slow a fan down or pull it and see what changes
Last edited:
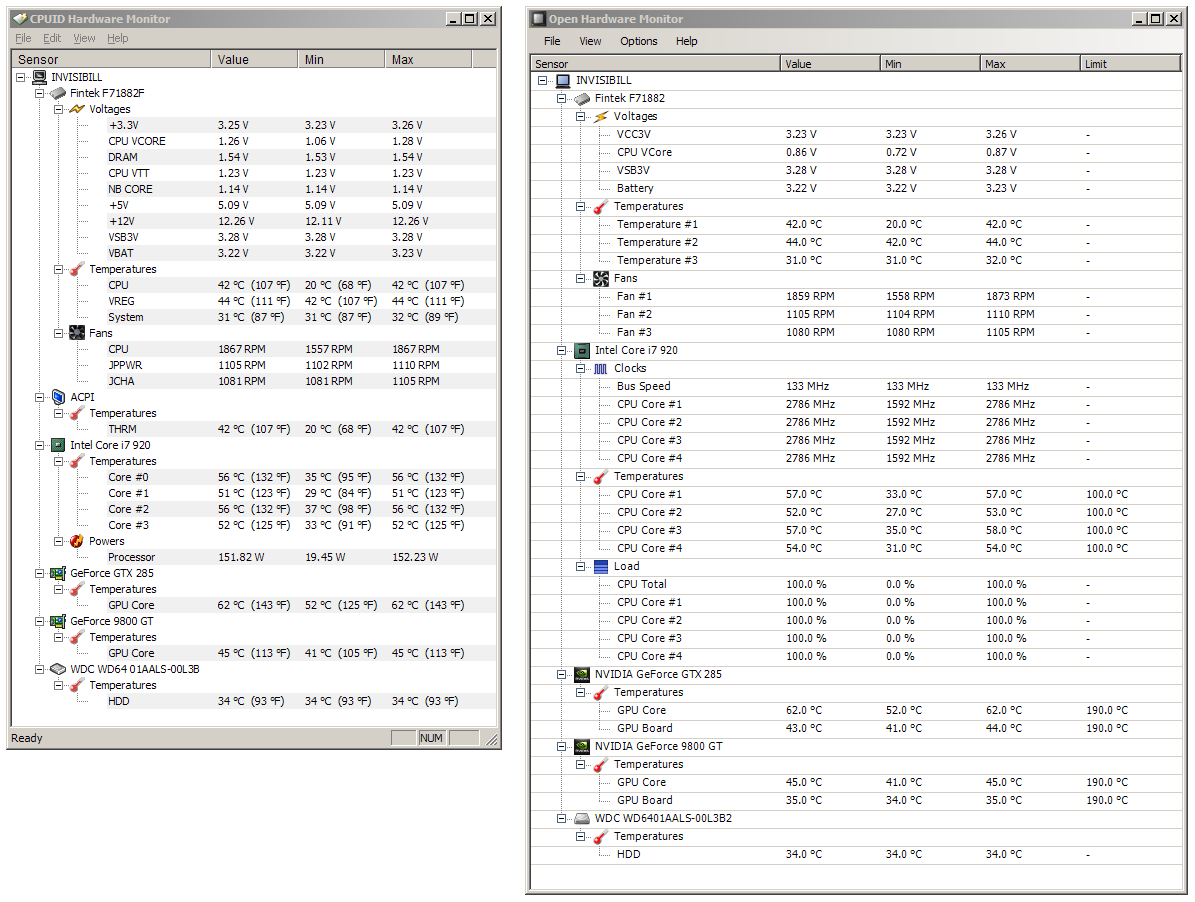
The main difference to the CPUID Hardware Monitor is, that the Open Hardware Monitor is free and open source, while the CPUID Hardware Monitor comes only as freeware binary. If you don't like some detail with the Open Hardware Monitor, you can download the source and change that detail. If I stop to continue the development, anyone can continue based on the MPL licensed source. With closed source software, chances are that at some point development stops without a way to add support for new hardware, bug fixes etc.
Beside this, the Open Hardware Monitor has already a few features more in the GUI, like temperature plotting (to be improved), system tray display with custom color setup, saved window size and position, minimize to system tray, option to start minimized, editable sensor names and a few minor details.
When comparing the supported hardware, then the CPUID Hardware Monitor still supports a lot more different hardware and is more stable. But the hardware support of the Open Hardware Monitor is no longer a strict subset of the support in the CPUID Hardware Monitor. T-Balancer bigNG support e.g. is not available in the CPUID Hardware Monitor.
@cbb77: I have taken a look at the fan reading problem. There is a small chance that the values are encoded in the Bank 6 and Bank 7 values of the w83667hgb chip. But I do not have any documentation about it, and can't figure out anything that would match the values on your screenshot.
Thanks for trying. Definitely will continue to use this as my standard. Let me know if there is anything in particular you would like tested.
InvisiBill
2[H]4U
- Joined
- Jan 2, 2003
- Messages
- 2,608
@InvisiBill: It would be great if you could create a OpenHardwareMonitor.Report.txt (File / Save Report) and a HWMonitor.txt (CPUID HWMonitor / File / Save Monitoring Data). And post the two text files or http://pastebin.com/ them.
http://pctech.invisibill.net/HWMonitor.txt
http://pctech.invisibill.net/OpenHardwareMonitor.Report.txt
Like Zero82z, my second card (9800GT) also didn't show up.
According to this, there's a GPU load function available only in the NDA Version of NVAPI. Not sure how that'd work out with an open source program like yours. GPU-Z does show it for me.

Thx. I think there is still something wrong with the byte alignment. Here is another version trying to detect the second Nvidia GPU correctly:
http://openhardwaremonitor.org/openhardwaremonitor-v0.1.23.2-nvidia-beta.zip
Would be great to get some feedback how this one is doing.
http://openhardwaremonitor.org/openhardwaremonitor-v0.1.23.2-nvidia-beta.zip
Would be great to get some feedback how this one is doing.
Ok, thanks for testing. I have created another version, which should improve the situation with more than one Nvidia card (hopefully).
http://openhardwaremonitor.org/openhardwaremonitor-v0.1.23.2-nvidia-2-beta.zip
http://openhardwaremonitor.org/openhardwaremonitor-v0.1.23.2-nvidia-2-beta.zip
InvisiBill
2[H]4U
- Joined
- Jan 2, 2003
- Messages
- 2,608
Seems to be showing the second card with the same level of detail as the first now.
I'm sure you've already looked through it, but I was actually looking at the NV CPL SDK stuff recently. A random comment somewhere mentioned something about finding it via WMI, though I didn't have much luck finding anything about that. http://http.download.nvidia.com/dev.../common/src/NvCpl/docs/NVControlPanel_API.pdf seems kind of old, but maybe it'll help. I'd really like to see the video card loads like in GPU-Z.
One minor thing, I've got those annoying gridlines in the app. I'm using XP x64, if that provides any more info that helps.
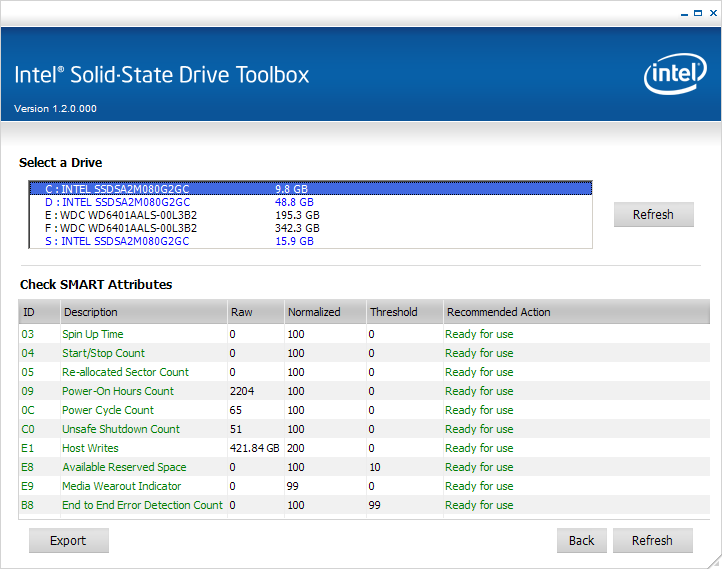
Are you able to pull specific S.M.A.R.T. attributes? I'm not sure how feasible it is, but the X25-M G2 at least shows total host writes and "wearout" percentage (E1 and E9 respectively). It'd be cool to be able to monitor the life of your SSD with OHM too. Not a big deal, just one of those cool things that every other monitoring app doesn't have yet. =)
Any chance of a °C/°F option for us dumb Americans? =) It's handy to be able to see both, to compare to ambient temperature and stuff when you're used to °F.
So far, this seems to be a great app. Keep up the good work!
I'm sure you've already looked through it, but I was actually looking at the NV CPL SDK stuff recently. A random comment somewhere mentioned something about finding it via WMI, though I didn't have much luck finding anything about that. http://http.download.nvidia.com/dev.../common/src/NvCpl/docs/NVControlPanel_API.pdf seems kind of old, but maybe it'll help. I'd really like to see the video card loads like in GPU-Z.
One minor thing, I've got those annoying gridlines in the app. I'm using XP x64, if that provides any more info that helps.
Are you able to pull specific S.M.A.R.T. attributes? I'm not sure how feasible it is, but the X25-M G2 at least shows total host writes and "wearout" percentage (E1 and E9 respectively). It'd be cool to be able to monitor the life of your SSD with OHM too. Not a big deal, just one of those cool things that every other monitoring app doesn't have yet. =)
Any chance of a °C/°F option for us dumb Americans? =) It's handy to be able to see both, to compare to ambient temperature and stuff when you're used to °F.
So far, this seems to be a great app. Keep up the good work!
Great, thx for testing.
About the gridlines: They should be a lot less visible (like on the screenshots on the OHM page). I think I will have to hardcode the color.
I am fetching all SMART attributes already, so reading some more should not be a problem. Is there any documentation about what these attributes E1 and E9 are? Normally E1 are the total number of load cycles (SMART). If there is a stable way to identify the SMART attribute, then displaying is no problem. I just don't want that random garbage gets displayed in case it is not an SSD.
About °C/°F: What does an an American prefer? Always °F (autodetect from windows local settings) or an option to switch the unit, or both at the same time (like CPUID HWMonitor)?
Last edited:
InvisiBill
2[H]4U
- Joined
- Jan 2, 2003
- Messages
- 2,608
Yup, lines are gone now, and the mobo stuff is sorted under "X58 SLI Classified" too.
Personally, I like both °F and °C. °F is more natural for me, but °C is pretty much the standard everywhere else so I like to have it available for comparing.
I don't really know much about the S.M.A.R.T. stuff. I was just going by what the Toolbox said.
Personally, I like both °F and °C. °F is more natural for me, but °C is pretty much the standard everywhere else so I like to have it available for comparing.
I don't really know much about the S.M.A.R.T. stuff. I was just going by what the Toolbox said.
Just wanted to post and say that I'm a big fan of OHM. No cryptic messages, just straight hardware descriptions with detailed listing. Temp readings are spot on.
Recommended additions - a way to "highlight" certain temperature readings (ie. GPU, CPU, HDD) so that they're easy to pick out at first glance.
Recommended additions - a way to "highlight" certain temperature readings (ie. GPU, CPU, HDD) so that they're easy to pick out at first glance.
InvisiBill
2[H]4U
- Joined
- Jan 2, 2003
- Messages
- 2,608
Looking at my screenshots above, I noticed an issue. OHM is showing my CPU VCore at 0.86V, while HWM shows the correct 1.26V. It does this in the latest posted 0.1.27 Beta as well.
As for the S.M.A.R.T. stuff, SSDs should show a rotational speed of 0RPM, so you could use that to filter which items to show (that's apparently how Win7 determines when to disable certain things for SSDs). Unfortunately, I can't test other SSDs to see what they show in those values, as I only have X25-M G2's.
As for the S.M.A.R.T. stuff, SSDs should show a rotational speed of 0RPM, so you could use that to filter which items to show (that's apparently how Win7 determines when to disable certain things for SSDs). Unfortunately, I can't test other SSDs to see what they show in those values, as I only have X25-M G2's.
Somehow your board seems to use a voltage divider with 4.7k and 10k resistors for the CPU vcore. I don't know yet how to detect that (except just hardcoding it for your board). Could you post an OpenHardwareMonitor.Report.txt created with the latest version? So I can add it to the issues list.
Awesome. Great project, it's looking very nice already. Starts faster and more features than HWmonitor, and open source. Loving it so far.
Everything reported seems spot-on for me, but I'm missing some voltages that HWmonitor reports. Here are my screenies and reports.

OHM: http://pastie.org/882463
HWmonitor: http://pastie.org/882466
Everything reported seems spot-on for me, but I'm missing some voltages that HWmonitor reports. Here are my screenies and reports.
If you just detected from Windows settings and didn't provide an option, I'd be pretty annoyed if you went to only showing F. I'm a dumb Canadian and don't understand Fahrenheit, and most PCs around here end up set for US locale.About °C/°F: What does an an American prefer? Always °F (autodetect from windows local settings) or an option to switch the unit, or both at the same time (like CPUID HWMonitor)?
OHM: http://pastie.org/882463
HWmonitor: http://pastie.org/882466
sirmonkey1985
[H]ard|DCer of the Month - July 2010
- Joined
- Sep 13, 2008
- Messages
- 22,414
id like to see both Celsius and Fahrenheit just for the hell of it.. but i prefer Celsius.. been using Celsius with computer temps my whole life i doubt i could ever change to using Fahrenheit even though i use it in every day life as well..
mmmmmdonuts
Gawd
- Joined
- Oct 7, 2009
- Messages
- 821
Wow. I have been using this for the last two weeks while monitoring my overclocks. It has worked perfectly. I like this a lot more than speedfan because it monitors more and seems to have a smaller system impact. Nice job, mmoeller.
InvisiBill
2[H]4U
- Joined
- Jan 2, 2003
- Messages
- 2,608
Somehow your board seems to use a voltage divider with 4.7k and 10k resistors for the CPU vcore. I don't know yet how to detect that (except just hardcoding it for your board). Could you post an OpenHardwareMonitor.Report.txt created with the latest version? So I can add it to the issues list.
http://pctech.invisibill.net/OpenHardwareMonitor.Report.1.27.txt
InvisiBill
2[H]4U
- Joined
- Jan 2, 2003
- Messages
- 2,608
I see that 0.1.28 is up on the site. I just threw together some extra parts to make another crunching PC, and OHM won't run on it. I tried both .27 and .28 with the same result.
This is a Dell GX280 with a 915 chipset and Celeron D 2.53GHz SL7TL running XP x86. I've got DEP turned on, but OHM is excluded just in case.
The application failed to initialize properly (0xc0000135). Click on OK to terminate the application.
This is a Dell GX280 with a 915 chipset and Celeron D 2.53GHz SL7TL running XP x86. I've got DEP turned on, but OHM is excluded just in case.
Thx for the report.
Is there an OpenHardwareMonitor.Crash.txt created in the Open Hardware Monitor folder? If so, could you post it? Do you have at least version 2.0 of the Microsoft .NET Framework installed?
I am working on better crash reporting to get more feedback in cases where the Open Hardware Monitor does not work. This should help to improve the overall stability.
InvisiBill
2[H]4U
- Joined
- Jan 2, 2003
- Messages
- 2,608
It was .NET causing the error. I'm used to my custom build and WSUS updates at work, and didn't have it included on this fresh build. It's working perfectly now.
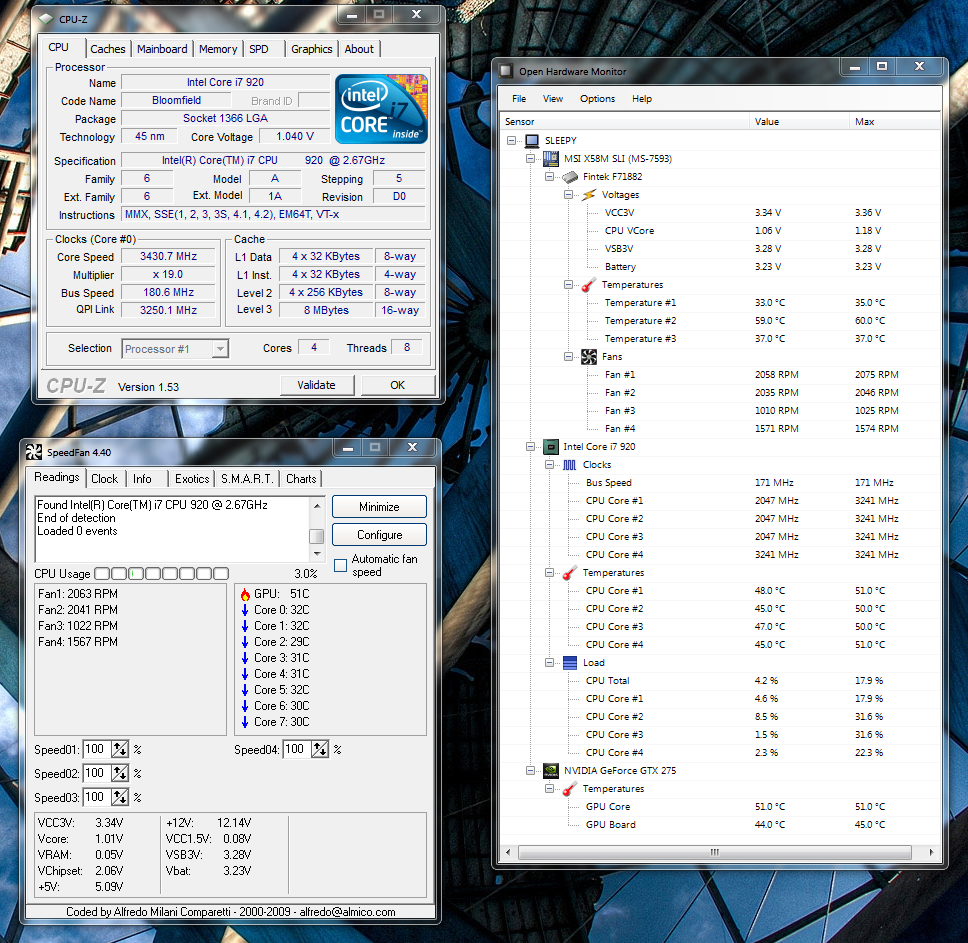
I am not sure what speedfan does there. As far as I know, the Core i7 920 has one core temperature sensor per core (so 4 in total) and not one per logical processor (thread). And the CPU-Z report (Hardware Monitors section) shows (more or less) the same temperatures as the OHM.
is this project still active? everytime i try to connect to http://openhardwaremonitor.org it just times out.
SicKlown42012
2[H]4U
- Joined
- Jul 6, 2008
- Messages
- 3,319
is this project still active? everytime i try to connect to http://openhardwaremonitor.org it just times out.
Try clearing you DNS cache. The website is still up, and the latest release is only a week old.

@JimmyC: Which region of the world are you trying to connect from? Have you tried with another browser? A few things (like the download) are also available from the the Google Code project page http://code.google.com/p/open-hardware-monitor/ where I host the source.
@4x4not: Thx for the feedback. Do you have two 5700 cards in crossfire, or does the CPUID HWMonitor just display the card twice?
@4x4not: Thx for the feedback. Do you have two 5700 cards in crossfire, or does the CPUID HWMonitor just display the card twice?
@JimmyC: Which region of the world are you trying to connect from? Have you tried with another browser? A few things (like the download) are also available from the the Google Code project page http://code.google.com/p/open-hardware-monitor/ where I host the source.
I'm in Australia. I've tried in firefox 3.6.3, IE8 and IE6 (at work). None of them work.
I did manage to grab it from the Google Code page though so thanks for that.
Angry
Limp Gawd
- Joined
- Feb 27, 2006
- Messages
- 482

Nice, I like it more than everst! Nice and simple....