Open Hardware Monitor

mmoeller

n00b
Joined
Feb 1, 2010
Messages
48
I am developing a free and open source hardware monitoring application, that can read temperatures, voltages, fan speeds, clock speeds and loads of CPUs, GPUs, mainboards and harddisks. Of course there are already some very good hardware monitor tools available, but none is open source (at least in the windows world). And if you need support for a bit more exotic hardware or features (as in my case) having access to the code is great.

Getting everything coded right for every possible hardware configuration is not so easy, above all if you don't have an infinite hardware collection to test on. So it would be great if a few interested users could test the Open Hardware Monitor (as the tool is called) and give feedback on any wrong readings or problems. Of course you can post any feature requests as well. The current version can be found on http://openhardwaremonitor.org/.

To report your test results just use "File / Save Report" and post the OpenHardwareMonitor.Report.txt created in the Open Hardware Monitor folder. If you compare with other tools, the best reference are the official tools from the manufacturer. But any other comparision is usually useful as well.
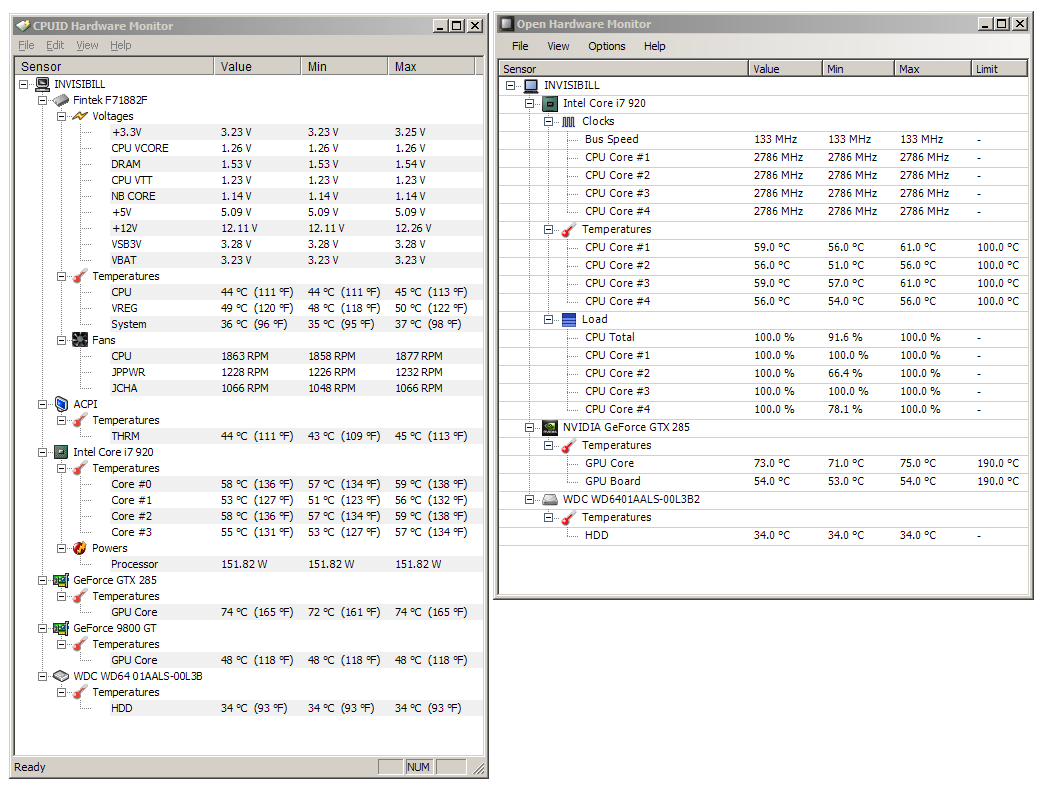
Screenshot:
screen0117b.png
 
yes it looks a bit like Everest and other similar tools, but there is no connection.

I have released a few new beta versions, adding support for core clock and bus speeds for Intel Core 2 and Core i3/i5/i7 processors. Beside this, it is now possible to display sensor values in the system tray (and many detail bug fixes).
 
Nice little program you have here. I just tried the latest version, and it's working great for the system in my signature. Compared it to both HWMonitor Pro and Everest, and everything matches up nicely.
 
nice program.....in comparison to CPUID HWMonitor it is within .5-1 deg of what that is reporting


only thin g- does your program support showing individual cores temp ? not a combined one.....


also a suggestion, add a min value column(like in CPUID HWMonitor), i find it useful for me.....


also in my setup(see sig), i only get one voltage listed(Battery for my onboard bat), and no fan speed show up
 
The Min column is there, you just have to right click(on the Sensor, Max, Value area underneath the toolbar) and select it.
 
ahh, my bad, musta missed that :p now i have it, and the limit column
 
AMD Phenom II CPUs have only one core temperature sensor per processor, which is used for all cores together. Of course I could just display the reading of that one sensor multiple times as some other programs do. But this would only create the illusion of very accurate readings since all core temps have exactly the same value, when in reality its just one value copied (or the same sensor read multiple times). Beside this it just uses more screen space without providing more information.

W.Feather, could you post or PM me an OpenHardwareMonitor.Report.txt, and a screenshot of an official monitor tool from the mainboard manufacturer (or a dump from CPUID HWMonitor) as reference? Maybe I can add more readings, which are filtered out right now.
 
good to know that there is only one core temp reader :)


ill get a CPUID dump for you tomorrow(im off to work on a school project, just ran home to take a shower)

here is the .report.txt:

Open Hardware Monitor Report

--------------------------------------------------------------------------------

Version: 0.1.21.1

--------------------------------------------------------------------------------

|
+-+ ITE IT8720F (/lpc/it8720f)
| +- Temperature : 0 : Temperature #1 : 31
| +- Voltage : 8 : Battery : 3.248
|
+-+ AMD Phenom II X2 550 Processor (/amdcpu/0)
| +- Load : 1 : Core #1 : 23.08083
| +- Load : 2 : Core #2 : 20.00406
| +- Load : 0 : CPU Total : 21.54245
| +- Temperature : 0 : Core #1 - #2 : 24
|
+-+ NVIDIA GeForce 9800 GTX/9800 GTX+ (/nvidiagpu/0)
| +- Temperature : 0 : GPU Core : 35
|
+-+ WDC WD3200AAKS-00SBA0 (/hdd/0)
| +- Temperature : 0 : HDD : 21
|
+-+ Hitachi HTS541616J9SA00 (/hdd/1)
| +- Temperature : 0 : HDD : 20

--------------------------------------------------------------------------------

SMBIOS

BIOS Vendor: American Megatrends Inc.
BIOS Version: 1105

Mainboard Manufacturer: ASUSTeK Computer INC.
Mainboard Name: Crosshair III Formula

--------------------------------------------------------------------------------

LPC IT87XX

Chip ID: 0x8720
Chip Name: ITE IT8720F
Base Address: 0x0290

Environment Controller Registers

00 01 02 03 04 05 06 07 08 09 0A 0B 0C 0D 0E 0F

00 19 00 FF 01 00 00 00 00 00 80 58 0F 00 00 00 00
10 FF FF FF 00 D7 80 7F 80 00 00 00 FF FF FF FF FF
20 00 6F 49 BA FF FF FF FF CB 1F 80 80 80 3F FF FF
30 FF FF FF FF FF FF FF FF FF FF FF FF FF FF FF FF
40 FF FF FF FF FF FF 5F 74 2D 40 95 00 FF FF FF FF
50 08 08 7F 7F 7F 50 56 56 90 56 03 12 E0 00 00 00
60 00 0A 46 7F 80 65 FF FF 00 18 46 7F 80 65 FF FF
70 00 18 46 7F 80 65 FF FF FF FF FF FF FF FF FF FF
80 00 00 00 00 00 00 00 00 00 00 00 00 00 00 02 00
90 FF 00 00 00 FF 00 00 00 FF FF FF FF FF FF FF FF
A0 FF FF FF FF FF FF FF FF FF FF FF FF FF FF FF FF

--------------------------------------------------------------------------------

CPUID

Processor Vendor: AuthenticAMD
Processor Brand: AMD Phenom(tm) II X2 550 Processor
Family: 0x10
Model: 0x4
Stepping: 0x2

CPUID Return Values

Function EAX EBX ECX EDX
00000000 00000005 68747541 444D4163 69746E65
00000001 00100F42 01020800 00802009 178BFBFF
00000002 00000000 00000000 00000000 00000000
00000003 00000000 00000000 00000000 00000000
00000004 00000000 00000000 00000000 00000000
00000005 00000040 00000040 00000003 00000000
80000000 8000001B 68747541 444D4163 69746E65
80000001 00100F42 10003B26 000037FF EFD3FBFF
80000002 20444D41 6E656850 74286D6F 4920296D
80000003 32582049 30353520 6F725020 73736563
80000004 0000726F 00000000 00000000 00000000
80000005 FF30FF10 FF30FF20 40020140 40020140
80000006 20800000 42004200 02008140 0030B140
80000007 00000000 00000000 00000000 000001F9
80000008 00003030 00000000 00002001 00000000
80000009 00000000 00000000 00000000 00000000
8000000A 00000001 00000040 00000000 0000000F
8000000B 00000000 00000000 00000000 00000000
8000000C 00000000 00000000 00000000 00000000
8000000D 00000000 00000000 00000000 00000000
8000000E 00000000 00000000 00000000 00000000
8000000F 00000000 00000000 00000000 00000000
80000010 00000000 00000000 00000000 00000000
80000011 00000000 00000000 00000000 00000000
80000012 00000000 00000000 00000000 00000000
80000013 00000000 00000000 00000000 00000000
80000014 00000000 00000000 00000000 00000000
80000015 00000000 00000000 00000000 00000000
80000016 00000000 00000000 00000000 00000000
80000017 00000000 00000000 00000000 00000000
80000018 00000000 00000000 00000000 00000000
80000019 F0300000 60100000 00000000 00000000
8000001A 00000003 00000000 00000000 00000000
8000001B 0000001F 00000000 00000000 00000000

--------------------------------------------------------------------------------

NVAPI

Number of GPUs: 1
 
awesome program.. nice work.. so far everything looks accurate.. any chance of getting +12v,-12v, +5v, -5v readings? ill have to check this on my HTPC system that has my asus board.. should give this program a run for its money since so far there is nothing that detects any of the sensors correctly.. especially the cpu voltage.. stupid asus bios.. but everything is running great on my phenom II rig..

heres what it looks like with a phenom II processor and nvidia gfx card..

newtempreadingprogram.png
 
Last edited:
does not work for me, After unzipping to its own folder I run with admin rights on win7 RC. and nothing happens. nothing opens up, just acts like it would for a split second. specs in sig
 
hmm odd.. its working fine for me in windows 7 ultimate 32bit.. i didnt have to give it admin rights to run either.. just unzipped and opened the program..
 
FalconSS, does it create a OpenHardwareMonitor.Crash.txt in the folder where the OpenHardwareMonitor.exe is? If so, please post it, so I can see whats going wrong.

Reading more voltages is on the todo list, but its difficult to get right in general, because it is usually mainboard specific. And I can't really implement code for every mainboard out there. That's why I read only the mainboard voltages that are always the same like VCore, 3.3V and VBat. So, compared to other programs I prefer to not display data instead of data that might very well be just completely wrong (and users worry why there -12V line "measures" +3.2V e.g.).
 
Won't run for me on Win7 64bit Ultimate. Here's the crash file:

System.ArgumentException: The given port name does not start with COM/com or does not resolve to a valid serial port.
Parameter name: portName
at System.IO.Ports.SerialStream..ctor(String portName, Int32 baudRate, Parity parity, Int32 dataBits, StopBits stopBits, Int32 readTimeout, Int32 writeTimeout, Handshake handshake, Boolean dtrEnable, Boolean rtsEnable, Boolean discardNull, Byte parityReplace)
at System.IO.Ports.SerialPort.Open()
at OpenHardwareMonitor.Hardware.TBalancer.TBalancerGroup..ctor()
at OpenHardwareMonitor.Hardware.Computer.Open()
at OpenHardwareMonitor.GUI.MainForm..ctor()
at OpenHardwareMonitor.Program.Main()
 
Thx for the report HydroBudz. This is a small problem and should be fixed with the version 0.1.21.3-beta just uploaded.
 
Been using it for about a day now and it works pretty well on Win 7 Home x64. I like that it shows max values for all sensors.

I also like being able to show values in the tray, but since I'm using a very dark theme the black colors barely show up.

I would upload a report file, but I can't do that yet, as this is only my 24th post.. :)

EDIT: Had to reboot and upon reloading OHM I see that the tray values disappeared... Perhaps a preferences ini file could be included for OHM to save user prefs?
 
Last edited:
Just saw a strange thing while looking at OHM. Under Temperatures/CPU the reading went from 41C to 2C and back about 4 times. Could this just be an anomaly caused by bringing OHM to the top?
 
For the settings to get saved in OHM you have to exit it normally. Rebooting might just stop the OHM and don't leave enough time to save the current settings. Once your settings are saved, rebooting shouldn't be a problem.

The tray display colors can be changed with a context menu on each tray sensor display.

Wrong readings from the mainboard super I/O chip (like ITE, Winbond, Fintek) are most likely caused by running more than one sensor monitor application at the same time. They can disturb each other while accessing the chip and cause wrong readings. There are other reasons which can cause wrong readings (very rarely). I will have to work more on this (also I guess it will never be 100% perfect, but still if its extremly rare, it should be fine).
 
Very nice tool. Works great on my setup: Core i5 750 on Asus Maximus III Formula. I also compared it to CPUID Hardware Monitor and Core Temp and values appear to be within .5 - 1 degree difference. I like this and will continue to use and test. I hope that you can continue to expand and also pursue developing Windows Gadget that can display some of these items. I like to monitor some system items and have been looking for something that can display temps such as this in nice Gadget along some of my other items.
 
OHM.png


Overall it's pretty good, but I'm missing a number of items compared to HWMon. I'd like to see GPU Load in there too.

Specs are in the sig. Let me know if you need any sort of hardware info report from me.
 
Windows Gadget is on the todo list.

@InvisiBill: It would be great if you could create a OpenHardwareMonitor.Report.txt (File / Save Report) and a HWMonitor.txt (CPUID HWMonitor / File / Save Monitoring Data). And post the two text files or http://pastebin.com/ them.
 
OHM.png


Overall it's pretty good, but I'm missing a number of items compared to HWMon. I'd like to see GPU Load in there too.

Specs are in the sig. Let me know if you need any sort of hardware info report from me.

Hmm, GPU Load show for me but currently displays 0. (may be accurate as not doing anything intensive at the moment.
 
Windows Gadget is on the todo list.

@InvisiBill: It would be great if you could create a OpenHardwareMonitor.Report.txt (File / Save Report) and a HWMonitor.txt (CPUID HWMonitor / File / Save Monitoring Data). And post the two text files or http://pastebin.com/ them.

Excellent. Very happy to hear this.

I'm sure you have a ton of to-do's on this but curious if you could crack the nut on my specific config. For some reason, none of the third party tools, HWMonitor, Speedfan, Core Temp or your tool is able to display my system fans. Only specific Asus Probe app (which I hate) will display this info. Curious as to why. Posted inquiry to CPUID forum but was never answered. Low priority but if you could crack this nut I'd be much obliged.
 
I am having a problem on my computer. The program works, but it only shows my Video card temps. Also, would it be possible that you could add Logitech G15/19 (I have the G19) support? I don't know if this is even possible.
 
Last edited:
@cbb77, can you post (or http://pastebin.com/ ) an OpenHardwareMonitor.Report.txt (File / Save Report). Maybe I can see what's wrong with the fans there.

GPU load is currently shown only for ATI cards, as I don't know how or where to get that info for Nvidia GPUs.

@jtvd78: You need to run the OpenHardwareMonitor with admin rights (and not from a folder on a network drive), to get more info.

Logitech G15/19 support is possible, but doesn't have very high priority for me to implement right now.
 
@cbb77, can you post (or http://pastebin.com/ ) an OpenHardwareMonitor.Report.txt (File / Save Report). Maybe I can see what's wrong with the fans there.

GPU load is currently shown only for ATI cards, as I don't know how or where to get that info for Nvidia GPUs.
.

Ok, posted to pastebin.com under same userid. Also I do have an ATI card - 5850.
 
Hey,

Nice work on this sofar, very tidy utility. Here is a comparison for me as I am also missing some voltages. Would it be possible to add meaningfull temp names for known sensors? might be helpfull for people who dont know which one to name.
http://img714.imageshack.us/img714/1541/comparisonp.png
And here is the pastebin of the hwmon and openmon reports.
http://pastebin.com/m6a40d7a
http://pastebin.com/m2b814f18
Thanks.

Edit: Would it be possible to add some GPU things like clock speeds, fan speed and memory used? Load would be nice but I dont think my card reports it.
http://img175.imageshack.us/img175/8864/gpu.png
 
Last edited:
@cbb77: I have taken a look at the default fan tacho registers, but no sign of any fan response. I have added some extended registers to the report of the new release version 0.1.21.4-beta. Could you create an OpenHardwareMonitor.Report.txt once more with this new version? And a screenshot of the Asus app (at about the same time, so that RPMs are the same).

@Wipster: Thx for the report. Adding meaningfull names to sensors is not easy, beacuse names need to be guessed more or less by the software. For voltages not only the name needs to be guessed, but also the scaling of the value. That's why I do not output the voltages which are often guessed wrong. But I will look into ways to improve that.

GPU fan speed should have been displayed for your system (in theory). But something seems to be wrong with the code. Adding the other info is not so easy, since its not exposed by the (public version of the) Nvidia driver API. I don't really know how GPU-Z gets access to the data.

dunno if you could get the source code or not for evga precision but that program has all the gpu, shader, memory clocks, along with gpu load, and memory usage for nvidia cards..
 
@cbb77: I have taken a look at the default fan tacho registers, but no sign of any fan response. I have added some extended registers to the report of the new release version 0.1.21.4-beta. Could you create an OpenHardwareMonitor.Report.txt once more with this new version? And a screenshot of the Asus app (at about the same time, so that RPMs are the same).

Here is a snapshot of the screen using 1.21.4 version.

ohmsnapshot.png


Also pasted the latest config at pastebin.

Much appreciated for taking a look at this,
 
@mmoeller
Are different IT8718F monitoring chips connected differently on different boards? If so you could have a lookup table chip vs board to define what is mapped where. I see Vbat is measured internally so will be in a fixed register from the datasheet, I guess Vcore is usualy fixed at reg 0?
Got the full datasheet and I am having a lookie through it to see if there are some interesting things hidden away. I can see that there is a recommended voltage arrangement from ITE, shame gigabyte don't seem to follow it.
 
Last edited:
Can you add multi-GPU support? It's only showing data for my first video card, but not the second. Other than that, it would be nice to have an option to adjust the Tjmax for Intel CPUs, preferably including the ability to set a different value for each core, and the ability to show temperatures in the system tray would be useful as well.
 
For Nvidia cards there is a larger API, but its available only to registered developers under NDA. EVGA precision uses that one most likely.

@cbb77: Thx, I will look into that as soon as I have sorted out some problem with the CPU temperature reading on Winbond chips.

@Wipster: Yes the monitoring chips are connected differently on different mainboards. It's not only the location on the chip that is different, but voltage dividers built with resostores are different as well. Only few things like VCore are connected directly at the smae pin on almost all boards. I will add a lookup table later on, but it is difficult to fill them with correct data, because there are no specifications or circuit diagrams for the mainboards (publicly). So it has to be guessed / identified most of the time.

@Zero82z: It should support multi GPU. What GPUs do you use? Option for setting TjMax is on the todo. I am just not sure yet, where to add it on the GUI. I had editable values in the Limit column once, which would change TjMax in the case of a CPU. But I removed that because it was to confusing, and too much of a hidden feature. Showing values in the system tray is already implemented. Rightclick the sensor you want to add. You can change even the color of the system tray sensor texts.
 
@Zero82z: It should support multi GPU. What GPUs do you use? Option for setting TjMax is on the todo. I am just not sure yet, where to add it on the GUI. I had editable values in the Limit column once, which would change TjMax in the case of a CPU. But I removed that because it was to confusing, and too much of a hidden feature. Showing values in the system tray is already implemented. Rightclick the sensor you want to add. You can change even the color of the system tray sensor texts.
I have a GTX260 and a 9600GSO. The GTX260 is displayed, but the 9600GSO is not.

Thanks for letting me know about the systray feature. Unfortunately, the black text doesn't work too well with my background, so it's not very visible.

What I suggest is that you create a dialogue box with options to configure Tjmax values as well as other settings, like being able to change the colours, fonts, and text sizes for the readings in the systray. That way, you can allow more configuration options without cluttering the main UI of the app.
 
Can you add multi-GPU support? It's only showing data for my first video card, but not the second. Other than that, it would be nice to have an option to adjust the Tjmax for Intel CPUs, preferably including the ability to set a different value for each core, and the ability to show temperatures in the system tray would be useful as well.


you can show temps in the system tray.. just right click on them then set to tray.. you can also change the colors of the tray icons.. by setting the icon to tray then right clicking it and changing the color.. it will change the text color.. i also have a black task bar but all my temp icons are set to red..
 
Last edited:
Zero82z: Most likely the 9600GSO does not expose any sensors on the public NVAPI. I think I will change the behaviour and just display the GPU without sensors for that case.
 
Back
Top