Why though.. Windows 11 "Shell Infrastructure Host" high CPU usage

atarione

2[H]4U
Joined
Mar 17, 2011
Messages
2,296
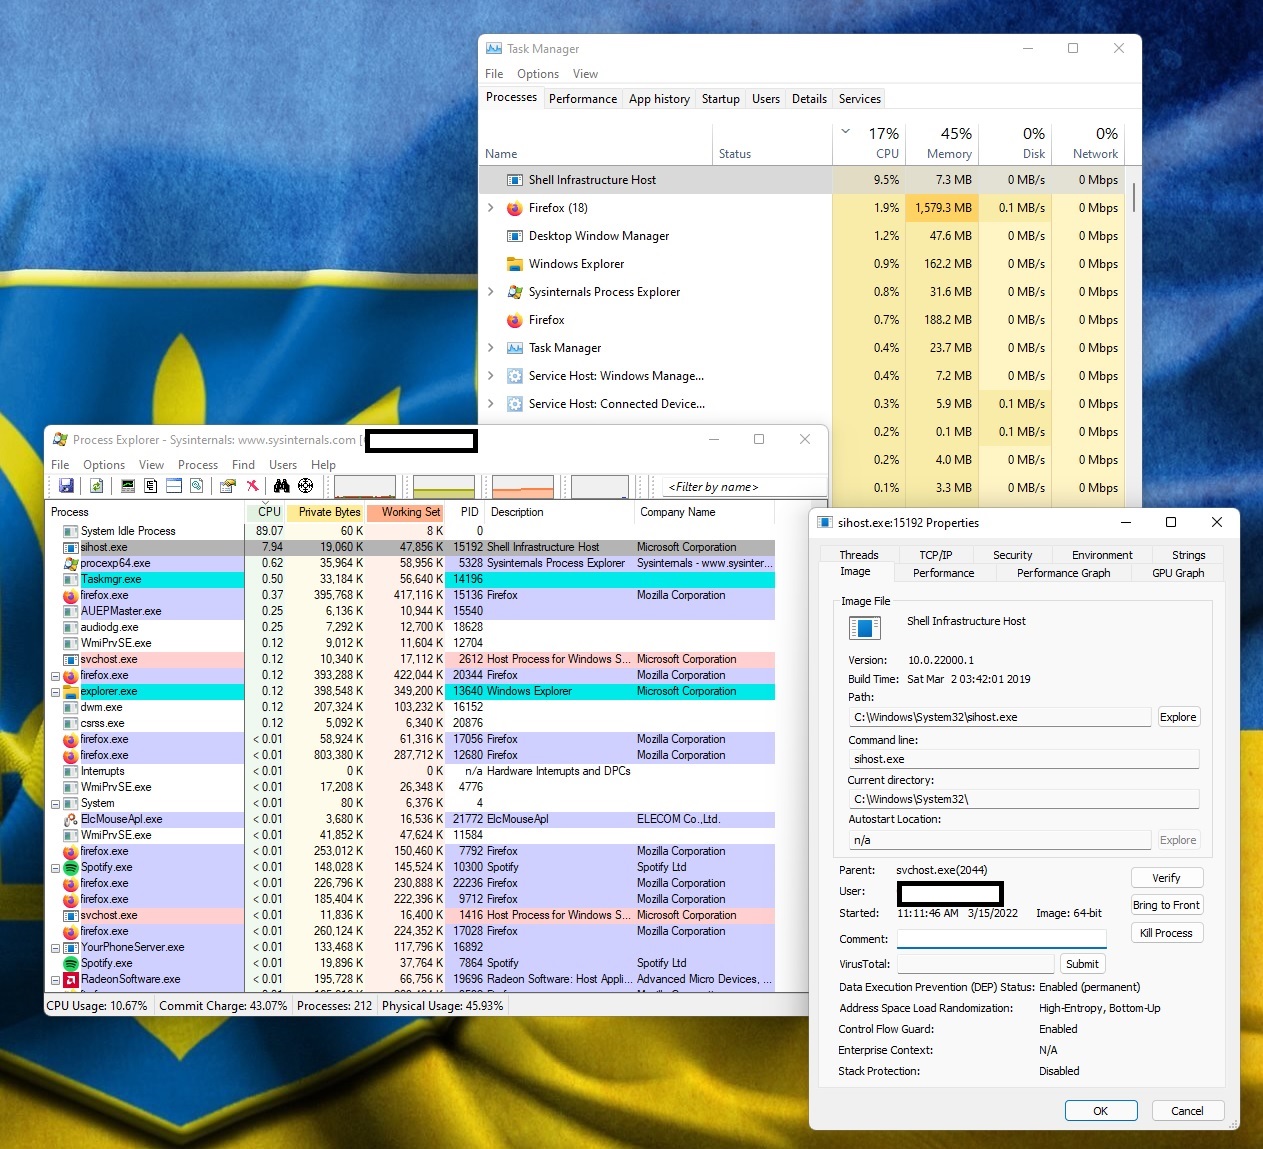
So.. does anyone know why Windows 11 keeps doing this (if you use the photos app) then even after you close it, I have 10%~ CPU usage from "Shell Infrastructure Host" process.. which shows "Very High" power usage as well... logging out and back in will stop it ..until you use the Photos app again then it happens again... Anyways if anyone knows anything about this and especially how to stop it that would be great... i tried updating all the store apps and windows update obviously but that hasn't helped.... looking at it now again 4~hrs after the photo app was last open and "Shell Infrastructure Host" process is just sitting at ~10% CPU...??? I have read a bunch of post about the issue and none that seem to say how to fix it, other than logging off / back on or rebooting.
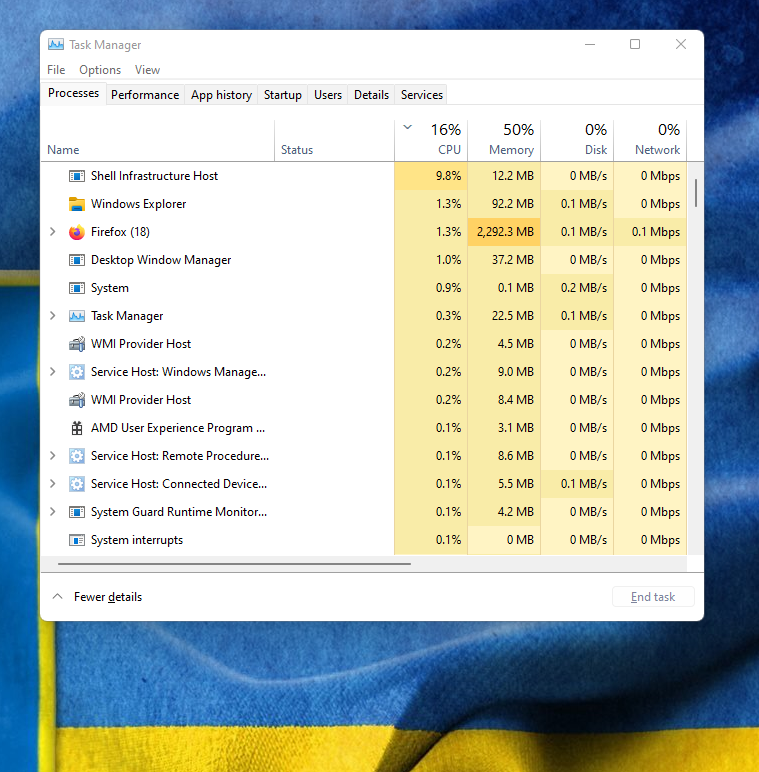

shellinfrastructure.png
 
When its CPU usage is high, download and run Process Explorer, then find sihost.exe in the list that corresponds to the instance that has the high CPU usage. I presume there will only be one instance.

If it has a parent process, such as svchost.exe, double click the parent and let us know what the 'Command line' value is. This tell us whether there's a service that spawned the sihost.exe instance and what that service is.

Next, double click the sihost.exe process in question, go to the Threads tab, sort the threads by CPU, double click the thread consuming the most CPU, select Copy All, and paste the thread stack here.

Some thread is stuck in a loop but we need to figure out which and why.
 
Google says it is the Microsoft photo app issue (removing from the list of default app could be something to try).
 
Google says it is the Microsoft photo app issue (removing from the list of default app could be something to try).

Yes, I did actually run into this exact issue. I changed my default program for .jpg and .png files from Photos to Paint and the issue went away.
 
It just makes me sad when people can't come on here, ask questions, and get help without having trolls use it as an opportunity to swoop in and threadcrap.
I agree. I just use the ignore function. But after ignoring the usual trolls, threads have gaping holes with weird responses. We have about 5-10 of the same people trolling the same stuff it seems. After a while it just seems to be tolerated and expected from these members. That’s a shame. And this thread derailed.

OP- did you get a 100% solid answer?
 
I agree. I just use the ignore function. But after ignoring the usual trolls, threads have gaping holes with weird responses.
Is that what happened here? Normally the ignored users' posts are replaced with has something like "x posts from ignored users". But in this thread.. I only see 6 posts total, including this one. Can't even go to the post you quoted.

Edit: situation explained - now let's see that Process Explorer stack trace!
 
Last edited:
When its CPU usage is high, download and run Process Explorer, then find sihost.exe in the list that corresponds to the instance that has the high CPU usage. I presume there will only be one instance.

If it has a parent process, such as svchost.exe, double click the parent and let us know what the 'Command line' value is. This tell us whether there's a service that spawned the sihost.exe instance and what that service is.

Next, double click the sihost.exe process in question, go to the Threads tab, sort the threads by CPU, double click the thread consuming the most CPU, select Copy All, and paste the thread stack here.

Some thread is stuck in a loop but we need to figure out which and why.


Hello, and thank you for the response / assistance.. So this is what I found.. If I have made any mistakes in collecting this please let me know.. I believe this is right? So sihost.exe doesn't seem to be spawned by another process? I think...?? and then this was the "Treads" copy all / past or whatever... I hopefully have got This right please advise if otherwise...

0x0000000000000000
Windows.Storage.dll!CreateItemArrayFromObjectArray+0x3b13
Windows.Storage.dll!Ordinal897+0x8eaf1
Windows.Storage.dll!Ordinal897+0x8bb51
Windows.Storage.dll!Ordinal897+0x8b9c8
shcore.dll!SHTaskPoolQueueTask+0x235
Windows.Storage.dll!Ordinal897+0x7e897
Windows.Storage.dll!Ordinal897+0x84902
Windows.Storage.dll!Ordinal897+0x82025
Windows.Storage.dll!Ordinal897+0x7e922
Windows.Storage.dll!Ordinal897+0x8b865
Windows.Storage.dll!Ordinal928+0x80cb
Windows.Storage.dll!Ordinal928+0x8053
shcore.dll!SHTaskPoolQueueTask+0x1e3d
shcore.dll!Ordinal120+0xe6e
shcore.dll!SHQueryValueExW+0x981
KERNEL32.DLL!BaseThreadInitThunk+0x10
ntdll.dll!RtlUserThreadStart+0x2b

processexplorer_R.jpg
 
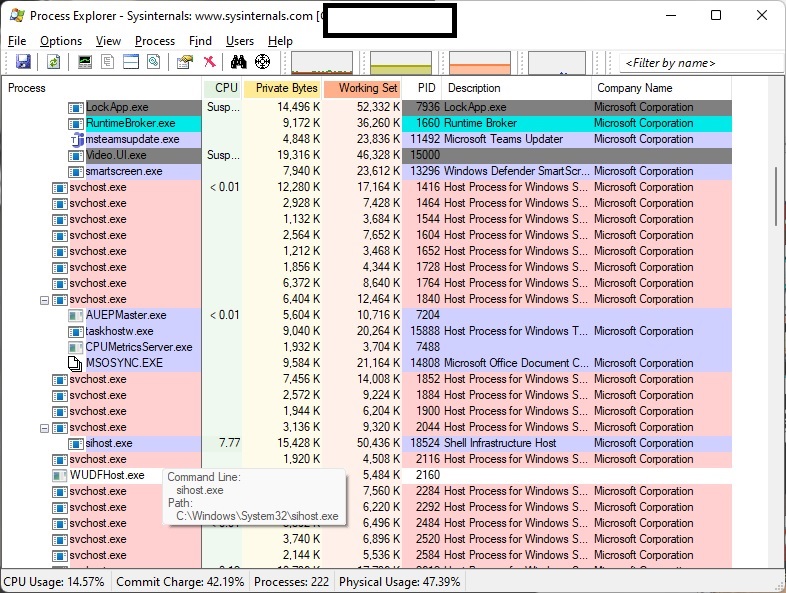
Perfect. Just need one more bit of info. By default Process Explorer sorts the process in a tree view, with every indentation being an nth level child process. With the columns sorted by CPU, however, that indentation disappears.

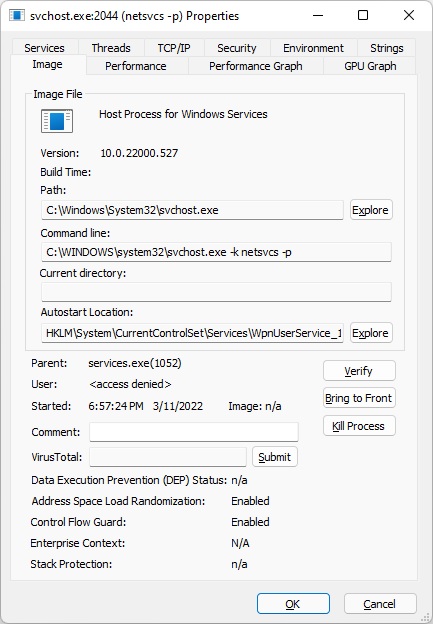
In the screenshot you showed, the sihost.exe properties window shows the parent process (svchost.exe) as well as the process ID (PID), 2044. Can you find svchost.exe with a PID of 2044 in the main Process Explorer window, double click on it, and reply with the contents of the "Command line" box? The svchost.exe PID might have changed if you've restarted.


ah... i see... sorry I was trying to find it before, didn't now it does that if you sort by cpu.. good to know... So i have this for you the PID still seems to be 2044... if anything else is needed please let me know.. and thank you for your assistance.
svchost2044_R.jpg
comandline.jpg
 
Although it doesn't show it in the Command line field (presumably because Process Explorer isn't run as admin), we can tell by the Autostart Location field that the service that svchost.exe process ran is UserManager (same on my Windows 10 machine). At least there's nothing out of the ordinary there.

Round 2, let's dig a little deeper.

The stack trace for the sihost.exe thread you pasted has a start address of shcore.dll!SHQueryValueExW+0x981 (the last 2 lines in the trace are threading-related and can be ignored). SHQueryValueExW is the function that started this mess, which means we need to figure out what it's doing. SHQueryValueExW is a Windows API function for reading the registry - some code in sihost.exe is reading/querying the registry over and over, continually, causing high CPU usage. Though Process Explorer can't show us exactly what is trying to be read, Process Monitor can.

Go ahead and download Process Monitor and do the following once it's launched:
  1. If you launch Process Monitor and you don't see the Process monitor Filter Window, ensure that capturing is turned off (File -> Capture Events / Ctrl+E), then go to Filter -> Filter...
  2. If you do see the window, close it and stop capturing (Ctrl+E) so that the log isn't spammed with results
  3. Clear the results it might have captured with Ctrl+X
  4. Go back to the filter window, Filter -> Filter...
  5. Change the dropdowns so that it reads "Process Name" "is" "sihost.exe" then "Include"
  6. Click Add
  7. Click OK
  8. On the toolbar just below the menu, unselect the 4 right-most icons (they correspond to "Show File System Activity", "Show Network Activity", etc.). We only want Show Registry Activity selected
  9. Press Ctrl+E to start capturing
  10. Wait about 30 seconds - you should see hundreds, if not thousands of events being captured
  11. Press Ctrl+E to stop capturing
  12. Press Ctrl+S to open the Save window and select
    • Events displayed using current filters
    • Native Process Monitor Format (PML)
Save the file somewhere, ZIP it (it's highly compressible), and either attach it to this thread or PM it to me. Just FYI, it'll contain your username and any registry keys sihost.exe queried, so there might be some sensitive info in there.

After a cursory glance at what registry keys/values it's accessing, it'll hopefully give us some insight into why it's doing what it's doing and how to prevent it.
 
Sorry to have not responded to this.. and thank you for the help... Apparently Microsoft fixed this because the computer has stopped doing this now.. so I guess problem solved for now???
 
Sorry to have not responded to this.. and thank you for the help... Apparently Microsoft fixed this because the computer has stopped doing this now.. so I guess problem solved for now???
atarione, I had to register onto this forum to thank you. I've been trying to solve this issue for months (in fact, arguably, possibly since the day I installed this OS a year ago). It was driving me nuts and my PC kept on running 10 degrees warmer (on AIO). Thanks to your post and your sharing, I was able to confirm it was a faulty, corrupt Windows' OEM Photos app (photos.exe). My photos app had troubles in the past; but no repair, no reinstallation was able to fully fix it. I did not expect it to be the culprit of a high power usage CPU issue. I've been using a third party, open source image viewer and everything's fine now. However, even after all the windows updates since then, none of the updates fixed my issue. That's okay since the third party image viewer is better anyway.

I would also like to add, for those that may have run into similar issues, these were the symptoms:

- PC would run fine for a while, like a good couple hours maybe, and the issue would appear
- CPU would run warmer, in my case, it was running 8 to 10C warmer than it should (and naturally, made my small room much warmer and stuffier)
- whenever I worked with files, say, copying JPEGs, saving new docs from microsoft word and such, files would not appear immediately in the folder. Even when creating new folders, that new folder would not appear immediately and prompt me to change the name "New Folder (2)" or whatever; it just wouldn't show up. Nothing would show up until I hit F5 refresh. This led me to a detective chase and I thought it was faulty explorer.exe
- I did run sfc scan now fixes and it did fix some corrupt files - but it was unrelated.
- I monitored my explorer.exe for a long time, couldn't find the culprit. Then I started closely watching the stuff I was doing on my PC - I was thinking, even if my PC was practically idle, it would still do that!
- others have said, it could be related to Quick Access or OneDrive or whatever, I disabled all of those and it didn't work
- restarting, or even logging out and logging in again, would fix the issue temporarily, but not for long. And will appear again.
- was searching like a mad man on all related terms; explorer.exe overheating, high power usage, files not appearing, etc etc, until I found atarione's helpful post here. Turns out, it was as simple as opening and using photos app

Thank you!
 
Back
Top