• Some users have recently had their accounts hijacked. It seems that the now defunct EVGA forums might have compromised your password there and seems many are using the same PW here. We would suggest you UPDATE YOUR PASSWORD and TURN ON 2FA for your account here to further secure it. None of the compromised accounts had 2FA turned on.
    Once you have enabled 2FA, your account will be updated soon to show a badge, letting other members know that you use 2FA to protect your account. This should be beneficial for everyone that uses FSFT.

What benchmark do you trust??

FLECOM

Modder(ator) & [H]ardest Folder Evar
Staff member
2FA
Joined
Jun 27, 2001
Messages
15,828
So I am playing around with some different controllers and running into an issue... different benchmark applications are giving me very different stories...

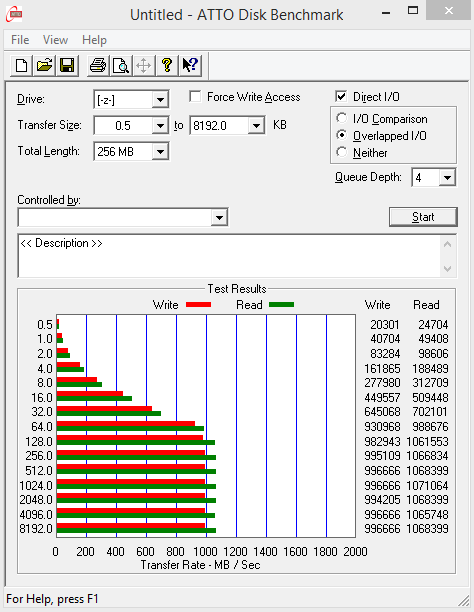
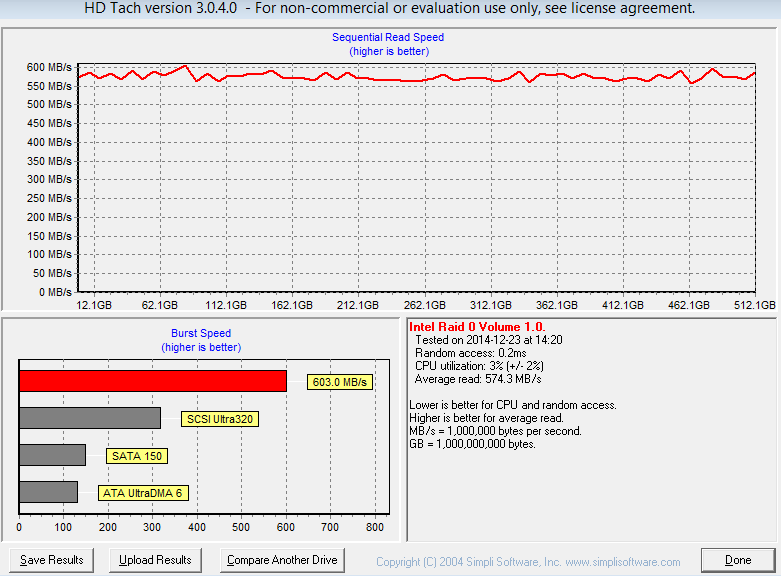
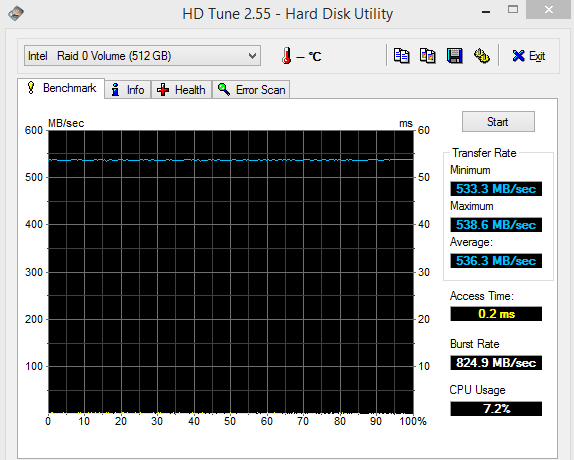
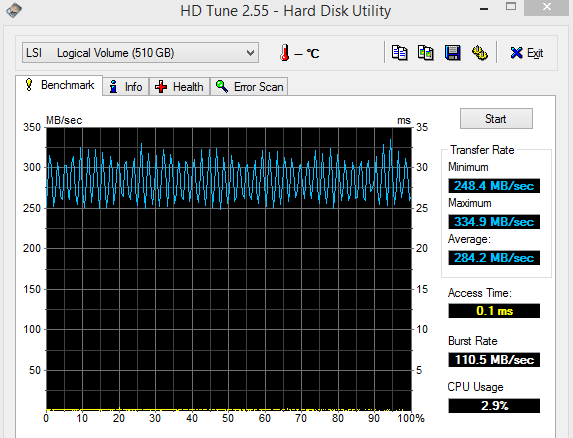
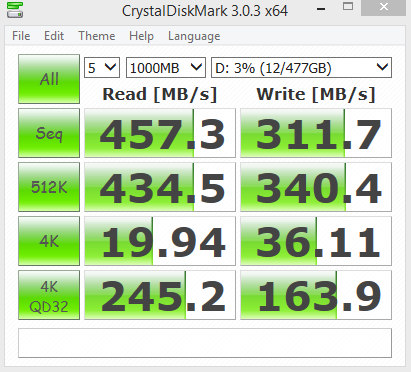
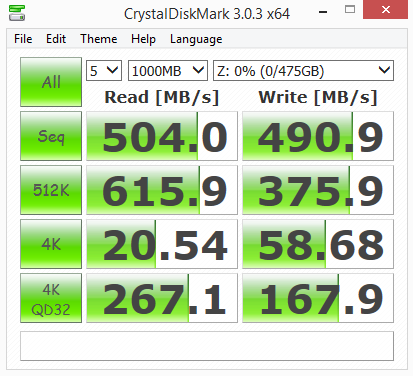
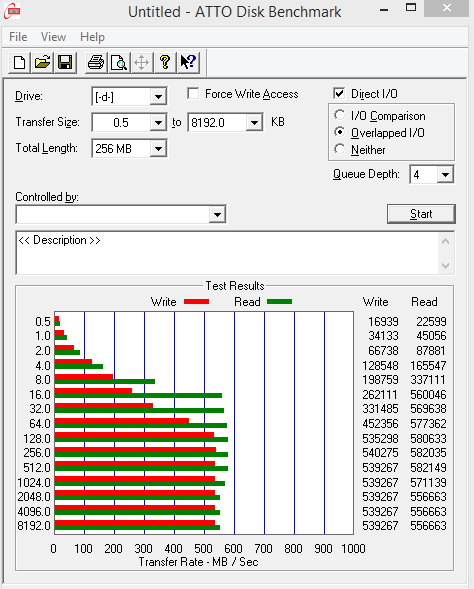
Left: 2x 840 PRO 256gb SSD RAID0 on onboard 3Gb/s 5520/ICH10R onboard

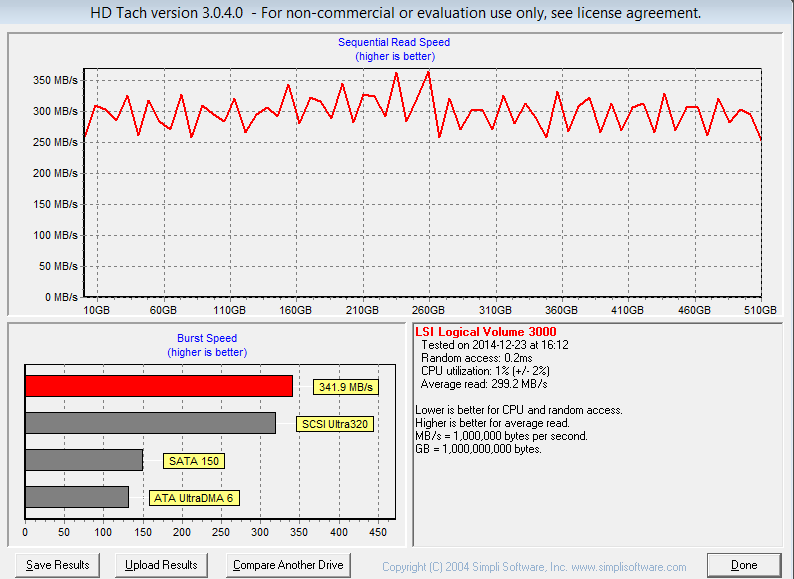
Right: 2x 840 PRO 256GB SSD RAID0 on LSI 9211 6Gb/s
021.png
031.png


022.png
032.png


023.png
033.png


024.png
034.png


so which one is right? ATTO shows a doubling of performance, crystal disk mark shows an increase, and HD Tune and HD Tach go way down (almost half)

so who is right?
 
Last edited:
I use iometer, since it lets me specify my own parameters.
 
They are all accurate, and mostly all useless also.

Each one of those tests, have different parameters controlling them, and therefor give different results.

Since none of those tests are likely to represent your ACTUAL workload, they don't really mean anything. The purpose of a benchmark is to test what your really going to be doing. And iozone is one of the tools that lets you adjust it's params to create a test like that.
 
They are all accurate, and mostly all useless also.
I think that appraisal is hyperbolic. They're useful to measure performance for whatever scenario they measure; and they're useful for comparison among the same test on different equipment. In cases where intended workload closely matches the test, they're valuable. And in cases where there's a known correlation between the performance of the intended workload and the performance of the measured workload, they're also useful.
 
Ya but what benchmark measures what? If this isa workstation for general application gaming and development use what benchmarks are useful?
 
for general application gaming and development use what benchmarks are useful?

Certainly not the any of sequential benchmarks. Of all the benchmarks you have done I say the 4K (not QD32) followed by the 512K CrystalDiskMark benchmarks are the most useful to most (not all) real world applications including games.
 
All the synthetic ones give you the "marketing specs" basically and show you the max sequential reads and writes in those tests, but the only ones I've used that gave me decent "real world" results that I can actually make some sense and use of are PCMark 7 and PCMark Vantage (both by Futuremark, makers of 3DMark).

Even Samsung feels that those two benchmarks more accurately reflect real-world usage scenarios by design:

http://www.samsung.com/global/busin...isite/SSD/global/html/about/whitepaper08.html

The best picture of a Samsung SSD’s performance will come from a system- level, trace-based performance test like PCMark Vantage or PCMark 7 because these tests closely approximate actual consumer usage scenarios.

Obviously with changes, there's PCMark 8 and Vantage is "retired" more or less since it was a Windows Vista-based (and designed) benchmarking suite.
 
Well, looks like you were using HDTach to measure sequential read speed. The top graph shows the the sequential read rate over the whole drive; the idea is to show if the sequential read speed changes from the beginning of the drive towards the end of the drive. I don't know what block size the test uses, or if it queues multiple reads. (I expect that it doesn't.) I also don't know what sampling it does; it's obviously not reading the whole drive, so it's skipping -- how big are the blocks it skips? Are they consistent, or random? As far as I know, HDTach is reading off the drive raw and not using the file system.

I don't think I've used ATTO, or at least not lately. What do the settings mean? Looks like "Transfer size" has a range, which suggests that it's sweeping the transfer block size from 512 bytes to 8 megs. That corresponds to the Y axis on the chart it draws, I guess. What is "total length"? If that means your test file is only 256 megs, it's quite possible the test file completely fills a cache on your LSI card and you're simply testing the cache on the card -- read requests never reach the actual drive. What does the documentation say about the settings that you're using?

CrystalDiskMark measures read and write speed. It measures sequential reads and writes over a file that it creates, matching the file size you give it. As a result, it does use the file system. If the file it creates is fragmented, that sequential read test isn't truly sequential. I don't think it queues any requests and just reads straight through the test file size you give it.

The other tests do random 512KB block reads, then random 4KB block reads, over that same file. It's only queuing a single request. Finally, it runs 4KB random block reads with a queue depth of 32.

How did you set the RAID0 stripe size on the two controllers when you set up the volumes?

These tests probably don't relate too closely to what you do with your computer, if you're doing "general application gaming and development". Mostly, desktop usage is going to read randomly with short sequential bursts thrown in. The block size will vary greatly, but might cluster around whatever allocation size is formatted for the volume.

You might want to use a program like DiskMon or Process Monitor to watch what your programs are actually doing. (You can even run these programs while the benchmarks are running to understand what the benchmarks themselves are doing.) With that in mind, you can find a benchmark that emulates that access more closely. Or, you can build a benchmark with IOMeter that does precisely what you want.
 
Last edited:
LSI 9211 has no cache nor does it allow you to chance the stripe size (64k)

the disks were completely empty during all benchmarking
 
LSI 9211 has no cache nor does it allow you to chance the stripe size (64k)

the disks were completely empty during all benchmarking

Great! Then you'll have to figure out what stripe size the on-board solution used. If the drives were empty, then it's very likely you were getting true sequential reads from the tests that use the file system.
 
I think the whole thing is being over-thought a little.

The on-board ICHR chipsets work very well with SSD's, the big kick in the nut-sack here is the use of SATA-II ports (the system would appear to be a server/WS board) but otherwise, having ability to pass TRIM through to the drives is a winner despite the slower max R/W speeds for which you will not notice on a working system!
The chosen RAID card is a rather crude and basic card and best used as either a IT/IR flashed HBA or used with non-parity RAID (RAID-1, 0, 10 Only). These cards also have some very big variances when it comes to SSD's as I have also tested the same card (Was and Intel badged PoS, flashed to LSI IR firmware) and the results you got are greatly different to mine (Mine sucked balls) but this is likely due to the block size.

I am going to assume you want to run an OS of the SSD's then I would be using the ICHR despite the slower SATA-II in interests of keeping a great performing system (I am referring to real-world usage and general feel as I don't go for stupid synthetics much). Keep the RAID for basic RAID or just flash the turd into IT and use it as a HBA. If you want to use the SSD's for an OS, then your choice of RAID-1 or RAID-0 is yours. RAID-0 of SSD's is a lot safer than older platter disks and if you use backups, then enjoy RAID-0 space and speed.
 
I think Lost-Benji means that everyone is always looking tweaks and configurations to get big numbers from benchmarks regardless of how well those numbers translate to real life usage. Combine that with additional factors like TRIM support, CPU usage under load, etc and make the best choice for you usage scenario.
 
Back
Top