• Some users have recently had their accounts hijacked. It seems that the now defunct EVGA forums might have compromised your password there and seems many are using the same PW here. We would suggest you UPDATE YOUR PASSWORD and TURN ON 2FA for your account here to further secure it. None of the compromised accounts had 2FA turned on.
    Once you have enabled 2FA, your account will be updated soon to show a badge, letting other members know that you use 2FA to protect your account. This should be beneficial for everyone that uses FSFT.

post your datastore latencies!

Thuleman

Supreme [H]ardness
Joined
Apr 13, 2004
Messages
5,833
Alright, so let's talk datastore latencies. I know that this is a complex subject, deployments cannot really be easily compared, all kinds of factors contribute to the root cause(s) of latency, but c'mon, live a little!

Post up your latencies, those with screenshots get extra credit, and maybe a little blurb on what hardware you are running this on, whether caching is used, and what the VM workload on that datastore is.

We just went out and obtained one big HP 3Par StorServ which is suppose to solve all storage problems and eliminate all the little SANs people have. Not sure what to make of it, but I am certainly looking forward to seeing latency graphs once datastores are active on that.
 
My latency numbers are super low on average (below 0.5ms read and write) but primarily because there is little IO activity going on. Between my 3 ESXi hosts only 27 IOPs. :) That's 12 VMs in VMware plus another 10 in Hyper-V and they're not hitting the array hard at all.
Some of the VMs are running on a Synology DS1812+ with 2x240GB Intel 330 SSDs as read cache and 6x WD 10k 600GB Raptor drives in RAID 5. The rest are on my primary file server which is 4x512GB Toshiba SSDs and 8x WD 10k 600GB Raptor drives in a mixed Storage Pool using RAID 10. The file server also uses 28GB of system memory as read cache and each vDisk from the pool has 8GB of SSD space as write cache.
 
Its really to much trouble to post graphs so I will guestimate lol.

5 Hosts, 97 VM's, 28 of which are Xenapp servers and I have seen our busiest lun hit 1200+ IOPS and around 12 ms latency, which is at the top end of what you want. This is LUN performance stats from the SAN and not off the hypervisor.

All in all our SAN normally pulls around 5k IOPS. Monday morning boot storms are higher.
 
I assume this is what you're looking for. My VM datastore is just a 256GB 840Pro sitting in my NAS. Nothing fancy. No tuning done to make it zippy or anything like that.

1_zpse2dce543.png
 
Last edited:
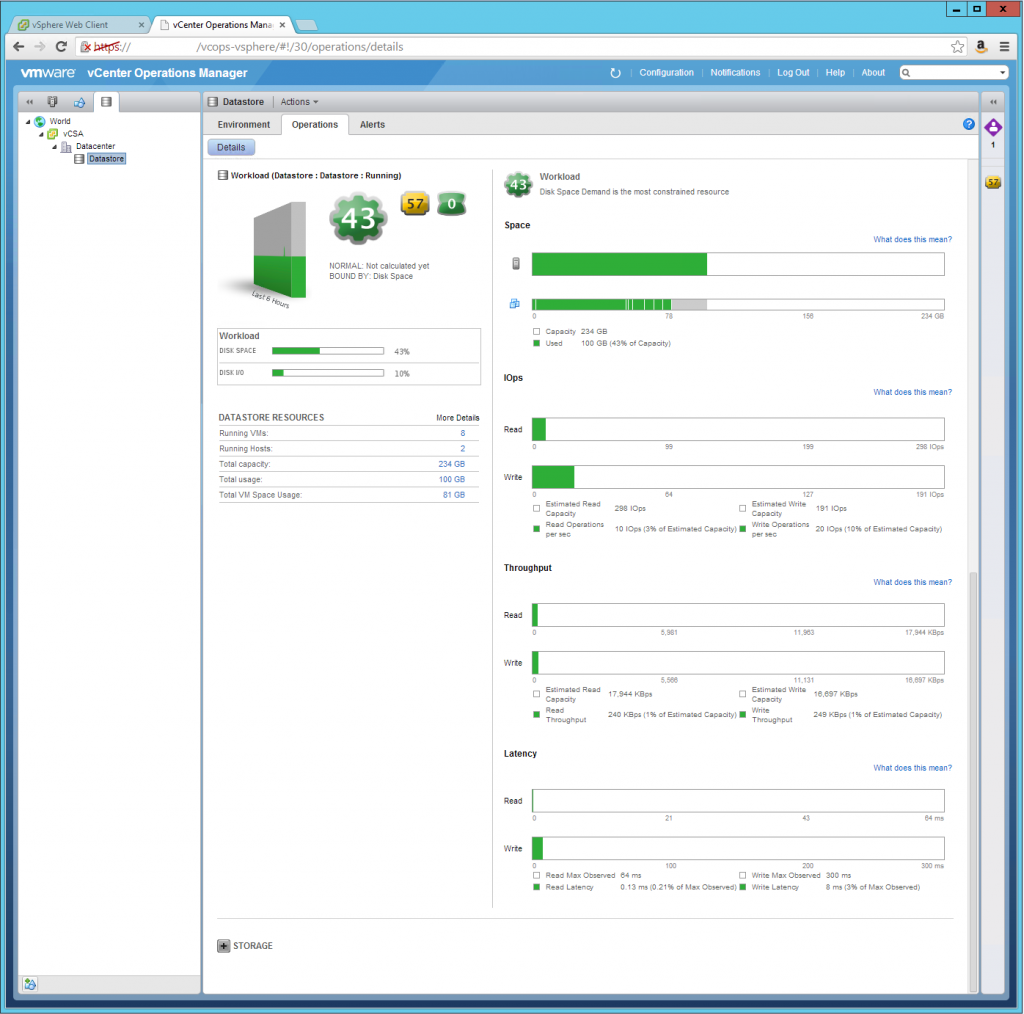
I can't post the screen shots, but looking at vCenter ops I'm currently looking at these stats for a randomly picked host out of the datacenter. Storage is an IBM XIV (g3). I don't have the specifics on it other than total capacity is around 288TB. Sorry, not the storage guy here.

IOps
Read ops/sec: 21
Write ops/sec: 17

Throughput
Read: 2469 KBps
Write:1572 KBps

Latency:
Read: 0.94ms
Write: 0.08ms
 
... ~50us...

;)

:D

I think that any threads about stats need to have a disclaimer that says "Folks who run ioFusion cards in their lab environment are not eligible to participate." !!! ;)

What I am finding is that all of your latencies are fairly low from where I am looking.

For example, 16x 1TB Seagate ES (ST31000424SS), one RAID10 raid group, split into 5 LUNs. These are currently the only workloads on the system:

evRuK8m.png


alhM65i.png


Device latencies are spikey but not terrible. VM latencies look bad though, but are those measurements real, or at least real enough?

EDIT: Fixed the imgur links.

So the question is, if the device latency numbers are correct, how is it that the VM disk latency numbers are so different?
How can VM disk latency be introduced without that the device reports latency?

Since I didn't buy a fancy SAN I don't have any SAN tools to show latencies. :(
 
Last edited:
@lopo
No opinion on why the VM disk latencies are so much higher than the physical device latencies?
 
Have an EMC XtremIO in the lab. Latency always under 1ms....

jealous.. had the xtreme IO rep in my office last week. great product, doesn't fix a problem I am currently not having tho.

at OP..

Depends.. I'm all over the place because it depends on the work load, and due to how important the VM is. Also depends on the teir of disk I dumped them one. Some vms a sub milliseconds.. others 50ms+..
 
Last edited:
@lopo
No opinion on why the VM disk latencies are so much higher than the physical device latencies?

if you have vm disk latencies, but physical device latencies are fine.. then there is some sort of VMware problem. To many VMs on a single data store running scsi queuing into the dirt.
 
if you have vm disk latencies, but physical device latencies are fine.. then there is some sort of VMware problem. To many VMs on a single data store running scsi queuing into the dirt.

Probably not the issue in my case, there are a total of 5 VMs on the entire SAN, and only 2 VMs on the JS1-4-LTS datastore (top screenshot I posted). Frankly, I am also not sure why the device latency spikes to 10ms in some cases. It's almost like the drives need to spin up for I/O, but they aren't set to spin down.
 
@lopo
No opinion on why the VM disk latencies are so much higher than the physical device latencies?

CAn't see the images from where I am - totally shitty internets till I make it to Singapore tomorrow. I'll know more then :( I'm basically in text mode now. :p
 
if you have vm disk latencies, but physical device latencies are fine.. then there is some sort of VMware problem. To many VMs on a single data store running scsi queuing into the dirt.

eh... not super likely anymore. Maybe, but maybe not. I'd need to know more about hte environment, and see the images (I've got the top 3 lines of pixels after 30 minutes of loading).

YAY Lynx!
 
how are they connected? fc, iscsi, or nfs?

iSCSI over GigE. Dedicated vlan for iSCSI traffic, flow control set to ON, access point mode, and there's overall little traffic on that network, so it's not like switch ports are getting saturated and induce latencies.

CAn't see the images from where I am - totally shitty internets till I make it to Singapore tomorrow. I'll know more then :( I'm basically in text mode now. :p

That's dedication! Half-way around the world and yet checking in on [H], nicely done! ;)
 
ok. First guess - not enough traffic.

If IOPS < 10, disregard all info in ESXtop, and assume that anything VC says is based on unicorns and fairy tales.

Pick a VM you don't mind doing this to, and reboot it. Look at the numbers while it's actually sending data. Betcha they're a LOT more normal.

Statistical analysis when you have zeros in there does weird things to math.
 
eh... not super likely anymore. Maybe, but maybe not. I'd need to know more about hte environment, and see the images (I've got the top 3 lines of pixels after 30 minutes of loading).

YAY Lynx!

If you have 40 fairly high chatty VMs on a single 2tb lun.. definitely a problem. You will not see it array side, or esxi side, but you'll see it in the guest os for sure.
 
Back
Top