vCenter SQL DB grew 100 GB in 10 days

KapsZ28

2[H]4U
Joined
May 29, 2009
Messages
2,114
Not sure what is causing the issue, but the MS SQL DB has grown over 100 GB in the past 10 days. I found some good information online about seeing where the large tables are and reducing size, but not really what may be causing the issue. No settings have changed. It just started growing and keeps growing. I was looking at these tables.

vpx_hist_stat1 to vpx_hist_stat4
vpx_sample_time1 to vpx_sample_time4
vpx_event and vpx_event_arg
vpx_task


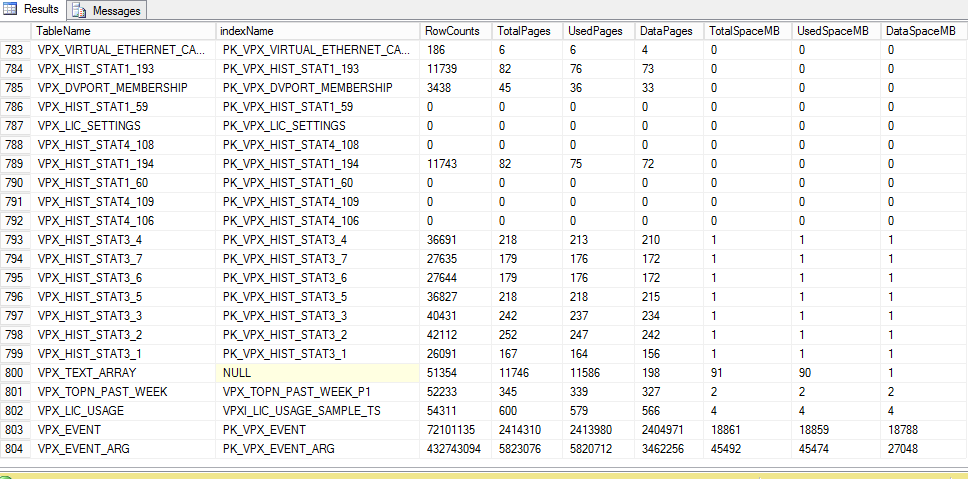
What I found is that instead of hist_stat1-stat4, there are about 240 tables. Although it seems most have a size of 0 MB.

A lot of the space is in the event and event_arg tables. Event is 19 GB and event_arg is 46 GB.

This is one of the articles I found, http://kb.vmware.com/selfservice/se...ype=kc&docTypeID=DT_KB_1_1&externalId=1007453, but it seems more focused on the vpx_hist tables. Any recommendations on how to clean this up and stop it from growing out of control?
 
No support contract?

I know that I had issues once and they had me replace the stats tables with defaults from the installer, if I recall correctly. This of course killed historical stats, but they were fubar anyway.
 
Last edited:
We have support, but they will want to get on the phone and do a remote session to see the issue. I rather just do some research and resolve on my own if possible.

I found this, but again the fact that it grew so large in the past 10 days, I don't think this is the actual solution. Although I will try it later and hopefully reclaim some space.

To purge the data in the VPX_EVENT table:

  1. Connect to Servername\SQL Database and log in with the appropriate credentials.
  2. Click databases to expand and select VIM_VCDB > Tables.
  3. Right-click the dbo.VPX_PARAMETER table and select Open.

    Note
    : If you are using SQL Server 2008, right-click the dbo.VPX_PARAMETER table and click Edit Top 200 Rows.
  4. Modify event.maxAge to 30, and modify the event.maxAgeEnabled value to true.
  5. Modify task.maxAge to 30, and modify the task.maxAgeEnabled value to true.

    Note:To improve the time of the data cleanup, run the preceding steps in several intervals. To do this, ensure to keep the default value of event.maxAgeand task.maxAgeand perform step 6 to run the cleanup. Then, reduce the event.maxAgeand task.maxAgevalue by 60 and run the cleanup. Repeat the steps until the value is reached to 30 for the final cleanup process.
  6. Run the built-in stored procedure:
    1. Go to VIM_VCDB > Programmability > Stored Procedures.
    2. Right-click dbo.cleanup_events_tasks_proc and select Execute Stored Procedure.

      This purges the data from the vpx_event, vpx_event_arg, and vpx_task tables based on the date specified for maxAge.
    3. When this has successfully completed, close SQL Management Studio and start the VMware Virtual Center Server service.
To ensure that the default Statistics Level is set to 1:

  1. Using the vSphere Client, log into vCenter Server as an administrator.
  2. Go to Administration > vCenter Server Settings > Statistics.
  3. Under Statistics Intervals, ensure the Statistics Level column is set to 1.
  4. To change the value, select the Interval Duration, click Edit and select Level 1 from the dropdown.
 
I've had this happen many times.
Check your maintenance jobs. You should have some cleanup tasks sched. If you don't have any or don't know which ones you need, hit the interwebs for a quick list.

Quick links :
http://www.bussink.ch/?p=495

http://blogs.vmware.com/kb/2013/05/the-inside-scoop-maintenance-tips-for-your-vsphere-database.html

This will keep happening if your jobs are failing.
If this isn't the case and your maintenance is configured and running correctly, ping the forum again and we can start to check some logs.

Nick
@vmnick0
 
I went through the steps above.

dbo.cleanup_events_tasks_proc and select Execute Stored Procedure

Also ran the additional SQL script in the article and then shrunk the DB. Only reduced it by about 5 GB.

There are no Maintenance Jobs setup. Veeam handles the backups and transaction logs. I basically just manually did maintenance last night, and not much of a difference.

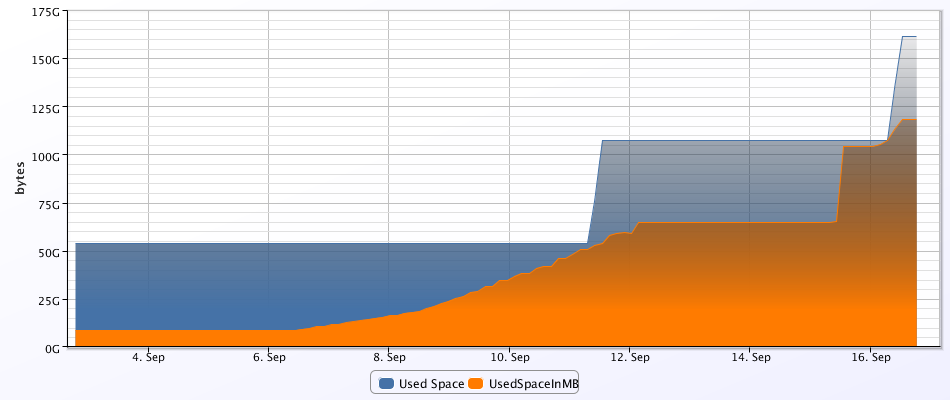
This was only an 8 GB database just 10 days ago and then rapidly grew. So I don't think it has anything to do with maintenance or old tasks/events. Then again, I am not really sure what would cause this. Below is a graph of the growth.

 
Have you tried limiting the age of records kept by vCenter from vCenter? Administration > vCenter Server Settings > Database Retention Policy, and turn on the retention limits
 
Have you tried limiting the age of records kept by vCenter from vCenter? Administration > vCenter Server Settings > Database Retention Policy, and turn on the retention limits

Yes, that is what I did last night. It was originally 180, I changed it to 30 and enabled it, then ran the events and tasks cleanup.
 
is it all in the trans logs, or the actual DB tables itself?

The DB. The transaction logs grow throughout the day, but after the backup runs, it goes back to a normal size. Right now the DB is 120 GB and LDF is 3 GB. Grew 10 GB since last night!
 
So I guess the statistics roll up jobs are working? That is alot of growth, the only thing I can think causing that much data growth are the real time stats not being rolled up.
 
So I guess the statistics roll up jobs are working? That is alot of growth, the only thing I can think causing that much data growth are the real time stats not being rolled up.

How often are real time stats rolled up? I don't think they would be constantly done throughout the day. This morning the DB was 109 GB. It is now up to 132 GB. Unless the server got infected and some sort of SQL injection is going on.
 
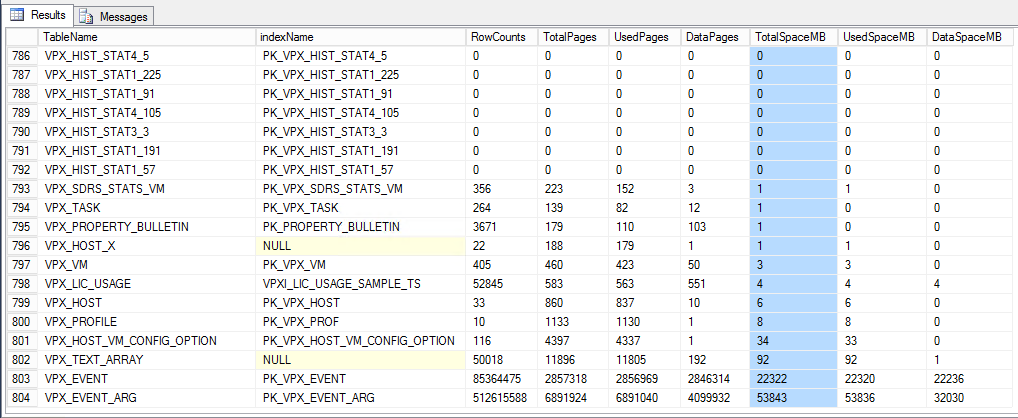
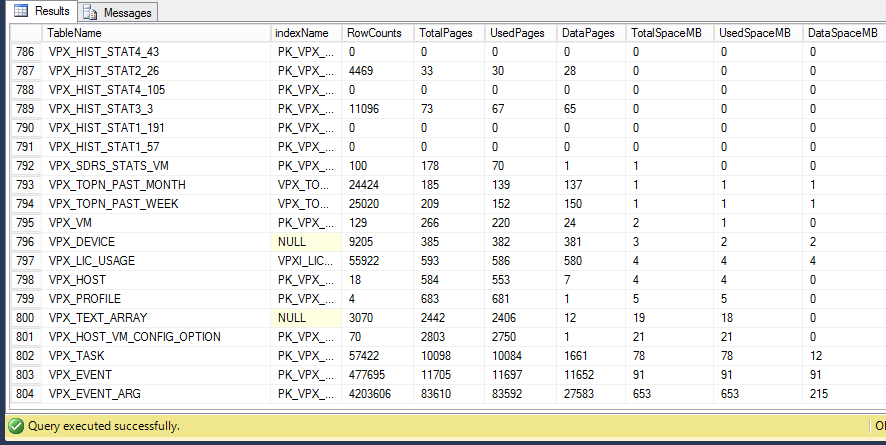
Amazing looking at the differences in table size when compared to another vCenter DB.

Here is the one that is having issues.


And here is another one that is working fine. All same versions.

 
24 hours ago the DB was 109 GB. It is now at 160 GB. Hopefully VMware Support can get this fixed today.
 
How often are real time stats rolled up? I don't think they would be constantly done throughout the day. This morning the DB was 109 GB. It is now up to 132 GB. Unless the server got infected and some sort of SQL injection is going on.

Looking at those tables, its not stats, but to answer your question, the real time stats are kept for 5 minutes by default before a SQL agent job rolls them up from 20 second intervals to 5 minute intervals for "past day" metrics.

I would be curious if some or many of your hosts are spewing a ton of events into the tables. Strange, I hope you do get it sorted out with VMware support, it sounds like a real mess.
 
Just Curious Kaps whats the Vendor of the HW u are using for your hosts?

Also what do the logs indicate is happening, logins? updates? whats in the events and events args tables that you can do a select from see why its pounding so hard.

I saw this same effect from a Vendors hardware before due to their storage appliance calling root login/logoff APIS every second, for ever host he added it exponentially grew! cause each host was using its own storage appliance to do the same thing. The events showed massive logins due to their want to gather metrics all the time on the storage.
 
Dasaint, I can't believe I missed this. It is totally coming from an ESXi host that was rebuilt on 9/6. There was an issue with the RAID controller on that host and I temporarily rebuilt it with a USB thumb drive. The events are non-stop, bur I am not sure what it means. It simply says "Alarm Host error on 'server' changed from Gray to Gray." It only shows up in Events, no Alarms and no additional information.
 
So restarting the services on the host with all the alerts seem to stop it. I checked syslog and vmkernel.log for that host and there are tons of these.

Code:
<177>2014-09-18T15:13:06.278Z vps24.corp.domain.net vmkalert: cpu1:66026461)ALERT: vmsyslog logger vcs01.corp.domain.net:514 lost 10 log messages
<182>2014-09-18T15:13:06.278Z vps24.corp.domain.net vmkernel: cpu1:66026461)ALERT: vmsyslog logger vcs01.corp.domain.net:514 lost 10 log messages
<177>2014-09-18T15:13:06.281Z vps24.corp.domain.net vmkalert: cpu21:66026462)ALERT: vmsyslog logger vcs01.corp.domain.net:514 lost 6 log messages

To me it sounds like that would mean there is an issue in the syslog configuration, but it is the same config it has always been with the exception that there is now no persistent storage. I didn't change any syslog settings. I just restarted the services.

Now I guess the big question is, how to I clean up this mess? Is going through the steps "To purge the data in the VPX_EVENT table" going to get rid of the events? I guess I would need to change the retention to 1 day being that many gigs is filling up each day.
 
yeah, those aren't the stats tables - those are actual ~events~ for some reason. I have NO idea what would cause that though...
 
Do you have SNMP traps enabled? The Gray to Gray sounds so familiar with something about SNMP stuff...

One thing to also look at on that host when you are doing your syslogging do you have the Use UNIQUE Directory enabled? depending on the syslog collector having that on is a big help b/c it allows separation of hosts and logs if u dont then they all try to fight over writing to the same log and creating issues with writing!

SNMP was setup and is the first thing I thought, so I disabled it, but the events kept coming.

Each server does syslog to it's own folder, so there is no conflicts there. There was so much activity that the 8 logs just kept rotating so quickly they basically all had the same timestamp on them.
 
We're having a similar issue at work. VMware support doesn't have a clue what's causing it but they want us to upgrade vCenter before they will troubleshoot further. Keep posting updates, curious what it turns out to be.
 
Other than what I posted about the single host logging events like crazy, I don't think I am going to investigate any further. The issue stopped. So now I just need to figure out how to get my DB back to a normal size.
 
Anyone know how I can get rid of all these events and shrink the DB? VMware Support never got back to me. After the events stopped, I changed the Database Retention Policy to 1 day hoping that the events that flooded vCenter would start purging. They have gone down a bit, but still over 500,000,000 rows left in the table.
 
Are you referring to the VCDB_Purge_MSSQL.zip file at the bottom? No, I did not run that. Was a bit hesitant as I didn't really see much information about it. So I just ran the dbo.cleanup_events_tasks_proc.

Yeah, that's what I was referring to.
It cleared out 9gb of data from a 10gb database.

I had also first tried decreasing the retention rates and running the stored procedure and not gotten very far. Then I ran that script.
 
We had the same issue in our datacenter. We opened a case with VMware (and HP) with no luck. We did find a solution on our own however:

https://communities.vmware.com/docs/DOC-28466

I hope it can help solve the problems you're having as well.

Funny, this just happened again to me with vCenter Appliance two days ago. I had the ESXi hosts doing syslog back to a different vCenter that was Windows based. Apparently the syslog stopped in late October, but I never noticed. Two days ago I went to log into vCenter and I couldn't. I logged into the appliance and saw that the postgres DB was 100% full. Ended up having to add a disk a create a larger partition.

What I don't get is why it always ends up being just one ESXi host that causes the problem. None of the other servers kept logging so many events. Just the one ESXi server was logging at least one even per second. Maybe more. I have now disabled remote syslog on all servers.
 
Our issue is finally resolved. It was some HP software pre-installed in the ESXi image that had a bug that would generate a login/logout event every second. We applied a patch which resolved the issue.
 
Funny, this just happened again to me with vCenter Appliance two days ago. I had the ESXi hosts doing syslog back to a different vCenter that was Windows based. Apparently the syslog stopped in late October, but I never noticed. Two days ago I went to log into vCenter and I couldn't. I logged into the appliance and saw that the postgres DB was 100% full. Ended up having to add a disk a create a larger partition.

What I don't get is why it always ends up being just one ESXi host that causes the problem. None of the other servers kept logging so many events. Just the one ESXi server was logging at least one even per second. Maybe more. I have now disabled remote syslog on all servers.

What makes the host different? Hardware/VIBs/Firmware/IPMI Firmwares? there has to be something that makes specifically 1 host react like that.... 99% of the time its 3rd party software creating havoc.
 
What makes the host different? Hardware/VIBs/Firmware/IPMI Firmwares? there has to be something that makes specifically 1 host react like that.... 99% of the time its 3rd party software creating havoc.

That is the part that is the most annoying. They are identical. All servers bought and imaged at the same time. They all had the same error about not being about to connect to syslog, but only one kept repeating that event over and over again. Only 3rd party software would be the LSI MegaCli and SMIS on the recent issue I experienced. The other group of servers also have NetApp vaai for NFS.
 
That is the part that is the most annoying. They are identical. All servers bought and imaged at the same time. They all had the same error about not being about to connect to syslog, but only one kept repeating that event over and over again. Only 3rd party software would be the LSI MegaCli and SMIS on the recent issue I experienced. The other group of servers also have NetApp vaai for NFS.

Same here... All hardware bought at the same time, same model, same install procedure,... We also encountered the same issue Sp33dFr33k had (HP AMS issues), but the syslog spamming kept going on even after applying all the latest HP patches.
 
Back
Top