Testing ZFS RAID-Z performance with 4K sector drives

MrLie, those are indeed quite disappointing results. Not sure if you already gave your system specs, but... are you using that PCI-X controller with expander? This could explain some of the disappointing results. It would also be the immature Marvell driver that gives you lower results. If all OS give you low performance, then it's not unreasonable to blame the hardware.

My current hardware:
Supermicro C2SBX
Supermicro AOC-SAT2-MV8 x2
Hitatchi 2 TB x16
Intel E8400
8 GB ram

I think (as Axan says in a few posts back) that my issue is that the PCI-X bus shares the total bandwith of 1064 MB/s, limiting my read to about 800 MB/s with overhead etc.
I managed 812 MB/s read with a 640 GB tmp-file using all 16 disks in raid0 using Nexenta, and got aprox 560 MB/s write. The difference in performance between Nexenta/OpenSolaris and FreeBSD, I assume has to do with the tuning/implementation of ZFS. I'm no software expert and can live with that difference. Hardware on the other hand is something I can do something about, just need to figure out which "right choice" to get:

  • For the right price.
  • For the right performance.
  • For the most value for money

This is where this forum comes in handy, where I can ask questions and get sensible answers back :)

And yes that ST3-F board looks great. Only 'but' would be no ECC support. It's loaded with features and it's not that expensive board at all! The onboard controller should work great; not sure about expanders but wouldn't you want to do it 'right' this time? Perhaps you can sell them (expanders + PCI-X controller) on ebay or something and make the purchase of one additional 1068E HBA and the onboard one less expensive? They should sell for like 100-120 dollars, the Intel SASUC8i is a bit more pricey.

The X8ST3-F do support ECC. I think you have to use ECC memory, if you're gonna use a Xeon cpu?
Current setup does not use any expander (my HBA's are SATA), but I got the HP SAS Expander in a box unused. My plans were to start using it in my next build (not gonna say final, because we all know that would be a lie :p). That should give me about 1 GB/S (realistic) bandwith, or double that if the Dual Link works from a LSI 1068E to the HP Expander, right?

Being in Europe (Norway to be exact) selling stuff on eBay is a bit more of a hazzle than being in the states (could be wrong though). Besides I can afford new toys without having to sell the old stuff first.


There are also the X8DT3-F and X8DT6-F, depending on whether you want 1068E or 2008 SAS2. They are around $450, so not the cheapest option, but they have the very nice Intel 5520 chipset, and plenty of room for expansion (if you later want to add a 2nd CPU or lots of RAM)

The X8DT6 is the single-IOH version of the X8DTH.

While those motherboards sure do look great, I think going with dual-socket is abit overkill for my use.
Buying a good cpu (like the Xeon E5620) and 24 GB ECC ram I think the X8ST3-F will be enough to fulfill my requirements to have a OpenSolaris/Nexenta/FreeBSD/OpenIndiana-based server with options for 1-2 VMs running aswell (the VMs will not be under any heavy load).
 
My current hardware:
Supermicro C2SBX
Supermicro AOC-SAT2-MV8 x2
Hitatchi 2 TB x16
Intel E8400
8 GB ram
It's a nice system for ZFS except the controllers i think. You motherboard has two PCIe x16 ports; you could buy two 1068E HBAs and be done with it! Or if you want to expand further, two 1068E HBAs and only one PCI-X HBA, that should work alot better. But avoid PCI/PCI-X if you can, it can particularly hurt ZFS random I/O performance.

If you need graphics, consider using a PCIe x1 to x16 converter and connect your graphics card there; it doesn't need much bandwidth anyway, right? It's also possible to switch one PCIe x16 into two PCIe x8, though i've not seen any products that do this. This can be done with a 'passive' converter though, no chip needed!

I think (as Axan says in a few posts back) that my issue is that the PCI-X bus shares the total bandwith of 1064 MB/s, limiting my read to about 800 MB/s with overhead etc.
That sounds like a reasonable conclusion of your benchmark tests on several OS.

Being in Europe (Norway to be exact) selling stuff on eBay is a bit more of a hazzle than being in the states (could be wrong though). Besides I can afford new toys without having to sell the old stuff first.

While those motherboards sure do look great, I think going with dual-socket is abit overkill for my use.
I think so too, and your current system is not that bad except for the HBAs perhaps. The cheapest investment would be two SuperMicro USAS-L8i HBAs (or Intel SASUC8i if you prefer the ATX bracket) and use only one of your PCI-X controllers. That gives you 24 ports and should scale beyond 1GB/s.

The question is can you actually use that kind of sequential performance? If you need more random I/O performance instead, an SSD may be a good value investment because even a small SSD can already have large performance benefits. Personally i would wait for the newer SSDs with supercapacitor to pop up, so you can use it for both SLOG/ZIL and L2ARC/cache functionality. The new Intel G3 perhaps, though 170MB/s may not be that appealing depending on how the competitors SandForce and Micron are doing.
 
After 2 days of cursing about extreme problems with my new disks (using Nexenta), I ended up trying ZFSguru (FreeBSD). No problems at all! I was stunned. But performance wasn't impressive (untuned though so that might be part of the reason) and I really didn't want to do the work of getting 15 TB to a previous zfs release (that would have required opensolaris anyway).

As a last resort I tried the new OpenIndiana release now and WOW that is some impressive stuff.

Out of the box performance:

root@future:/tester# dd if=/dev/zero of=zerofile.000 bs=10M count=3200
3200+0 records in
3200+0 records out
33554432000 bytes (34 GB) copied, 94.399 s, 355 MB/s
root@future:/tester# dd if=zerofile.000 of=/dev/zero bs=10M
3200+0 records in
3200+0 records out
33554432000 bytes (34 GB) copied, 63.524 s, 528 MB/s

Best of all - no scrub errors so far. I'm not using Nexenta again that's for sure - this is just one of a myriad of problems I've had with that "frankenstein" OS - and this one was really serious for hardware a lot of us uses - almost ended up screwing up 8 TB worth of data...

My wife will be happy that I'm in a better mood now :)
 
Would be nice if you can compare to ZFSguru while using the recommended tuning variables; you need to install ZFS-on-root for that, and then visit the Tuning page to click Reset to recommended values button. Then you can perform a mini-benchmark on the Pools page, when you click your pool. That should only take a minute or so.

Perhaps i can do the tuning automatically when you install ZFS-on-root? I would need to use 'safe' values, though.

Whatever solution you choose, you may want to consider creating your pool with a lower ZFS version instead, so it remains compatible. As long as you don't use the newer features, this shouldn't hurt any bit. Though i agree version 15 is getting very dated now, with commercial Solaris 9/10 release having ZFS v22 (v21 disabled) already.
 
As a last resort I tried the new OpenIndiana release now and WOW that is some impressive stuff.

AFAIK the openindiana build that's currently available, b147, hasn't really changed or improved anything upon the last OpenSolaris build that it's based on, but I'm sure it's fairly solid and that any time now all the dev that's been going on will trickle down into a new build. You might want to check out the napp-it GUI to manage OpenIndiana, which simplifies things a lot. It you don't like it, you can roll back to the checkpoint it creates prior to installation.

My wife will be happy that I'm in a better mood now :)

Mine knows *all about* the bad mood thing when there's terabytes of data on the line!
 
Last edited:
So if I'm building a new OpenIndiana server with five 2TB 4k drives, what are the best practices for an ideal setup in terms of performance when using RAIDZ1 or RAIDZ2? I'm a little confused on the different methods and making sure the changes are persistent between reboots.
 
So if I'm building a new OpenIndiana server with five 2TB 4k drives, what are the best practices for an ideal setup in terms of performance when using RAIDZ1 or RAIDZ2? I'm a little confused on the different methods and making sure the changes are pera tool that sets asistent between reboots.

I would suggest using RAIDZ1. Out of the box performance (atleast with F4EG drives) seems pretty good on my hardware - but creating the pool using a modified zpool too tool from DigitalDJ referenced earlier in this thread (setting ashift=12) gives the performance a slight edge.

My limited testing so far gives the impression that no other tweaking is manditory. I haven't tried random access (iSCSI/NFS) from my ESXi server yet though.

My plan now is to ditch my current 14 drives (7x1,5tb, 7x1tb) and go for 10x 2TB F4EGs...
 
AFAIK the openindiana build that's currently available, b147, hasn't really changed or improved anything upon the last OpenSolaris build that it's based on, but I'm sure it's fairly solid and that any time now all the dev that's been going on will trickle down into a new build.

Even though I'm a newbie at this forum I've used solaris as a NAS since 2006 with a bunch of top-of-the-line 250GB disks :) Boy is thing easy now compared to then (Solaris Express back then was a pain in the ... to install). But since Solaris has been so stable I've usually only changed OS when I'd changed hardware (I think I had about 370 days uptime on one of my builds...).

Last time I did a hardware change, I opted for Nexenta since OpenSolaris just died. Nexenta is the ONLY time I've experienced a unstable Solaris based OS. Faults before that was ALWAYS caused by flaky hardware or bad sata cables. I should have stopped using it the moment it required that all NFS clients had to be in the hostfile for it not to crash...

I will perhaps try napp-it on OpenIndiana. I used it on Nexenta, and never got around to learning how to configure COMSTAR manually...

Sorry about straying a bit off topic here.

I will try to do a new FreeBSD ZFS test asap - I'll pick up 4x more F4EG today and try a test tonight.
 
Did a limited test - zfs-on-disk and optimal values.

Aborted it due to the terrible performance. I'll try some other settings.


Code:
ZFSGURU-benchmark, version 1
Test size: 16.000 gigabytes (GiB)
Test rounds: 1
Cooldown period: 2 seconds
Sector size override: 4096 bytes
Number of disks: 10 disks
disk 1: gpt/disk8.nop
disk 2: gpt/disk9.nop
disk 3: gpt/disk10.nop
disk 4: gpt/disk7.nop
disk 5: gpt/disk6.nop
disk 6: gpt/disk5.nop
disk 7: gpt/disk4.nop
disk 8: gpt/disk1.nop
disk 9: gpt/disk2.nop
disk 10: gpt/disk3.nop

* Test Settings: TS16; TR1; SECT4096; 
* Tuning: KMEM=3g; AMIN=1g; AMAX=2g; 
* Stopping background processes: sendmail, moused, syslogd and cron
* Stopping Samba service

Now testing RAID0 configuration with 8 disks: cWmRd@
READ:	166 MiB/sec	= 166 MiB/sec avg
WRITE:	648 MiB/sec	= 648 MiB/sec avg

Now testing RAID0 configuration with 9 disks: cWmRd@
READ:	164 MiB/sec	= 164 MiB/sec avg
WRITE:	711 MiB/sec	= 711 MiB/sec avg

Now testing RAID0 configuration with 10 disks: cWmRd@
READ:	169 MiB/sec	= 169 MiB/sec avg
WRITE:	728 MiB/sec	= 728 MiB/sec avg

Now testing RAIDZ configuration with 8 disks: cWmRd@
READ:	143 MiB/sec	= 143 MiB/sec avg
WRITE:	465 MiB/sec	= 465 MiB/sec avg

Now testing RAIDZ configuration with 9 disks: cWmRd@
READ:	230 MiB/sec	= 230 MiB/sec avg
WRITE:	450 MiB/sec	= 450 MiB/sec avg

Now testing RAIDZ configuration with 10 disks: cWmRd@
READ:	187 MiB/sec	= 187 MiB/sec avg
WRITE:	471 MiB/sec	= 471 MiB/sec avg

Now testing RAIDZ2 configuration with 8 disks: cWmRd@
READ:	103 MiB/sec	= 103 MiB/sec avg
WRITE:	401 MiB/sec	= 401 MiB/sec avg

Now testing RAIDZ2 configuration with 9 disks: cWmRd@
READ:	114 MiB/sec	= 114 MiB/sec avg
WRITE:	418 MiB/sec	= 418 MiB/sec avg

Now testing RAIDZ2 configuration with 10 disks: cWmRd@
READ:	95 MiB/sec	= 95 MiB/sec avg
WRITE:	421 MiB/sec	= 421 MiB/sec avg

Now testing RAID1 configuration with 8 disks: cWmRd@
READ:	90 MiB/sec	= 90 MiB/sec avg
WRITE:	115 MiB/sec	= 115 MiB/sec avg

Now testing RAID1 configuration with 9 disks: cWmRd@
READ:	97 MiB/sec	= 97 MiB/sec avg
WRITE:	114 MiB/sec	= 114 MiB/sec avg

Now testing RAID1 configuration with 10 disks: cWmRd@
READ:	93 MiB/sec	= 93 MiB/sec avg
WRITE:	113 MiB/sec	= 113 MiB/sec avg

Now testing RAID1+0 configuration with 8 disks: cWmRd@
READ:	103 MiB/sec	= 103 MiB/sec avg
WRITE:	417 MiB/sec	= 417 MiB/sec avg

Now testing RAID1+0 configuration with 10 disks: cWmRd@
READ:	104 MiB/sec	= 104 MiB/sec avg
WRITE:	481 MiB/sec	= 481 MiB/sec avg
 
Ok... So... My choice is clear...

8+2 raidz2 - Samsung F4EG (4k)

FreeBSD:
Pool Mini-Benchmark

Pool: zpool-freebsd-rz2

Read throughput: 116.6 MB/s
Write throughput: 263.7 MB/s

OpenIndiana:
root@future:/bunch# dd if=/dev/zero of=zerofile.000 bs=10M count=3200
3200+0 records in
3200+0 records out
33554432000 bytes (34 GB) copied, 61.769 s, 543 MB/s
root@future:/bunch# dd if=zerofile.000 of=/dev/zero bs=10M
3200+0 records in
3200+0 records out
33554432000 bytes (34 GB) copied, 58.9148 s, 570 MB/s
 
Did you do anything special to create the pools in OpenIndiana? ashift binary swap?

I used ashift 12 binary - but performance was good even without. I suggest just trying it - I have no idea if ashift=12 has any hidden "problems" (like zfs send/receive compatibility) but I don't think so.
 
ashift patch is dangerous, but you can use ZFSguru gnop method to force your pool to be ashift=12 even without using any patched ZFS code, this is the safest route and you should be able to import the array in any Solaris-derivative. I don't think Solaris has a GNOP-alternative.

@Flintstone: with only 4GiB RAM FreeBSD disables prefetching, you may want to enable it in the tuning menu if you want to try again. Any reason for the discrepancy between benchmark and mini-benchmark results? The benchmark scores do show reasonable write throughput. It's perfectly possible the memory management under Solaris-derivatives works much better for ZFS than on FreeBSD. Let's hope that changes for ZFS v28.
 
Outch... A small bunch of new CKSUM errors occured 4TB into a scrub (OpenIndiana). Maybe I'll have to look into checking my hardware again or try an older OpenSolaris release :(

Edit: I suspect this is a MB or RAM problem. Not the disks. Nowhere near as unstable as with Nexenta.
 
Last edited:
ashift patch is dangerous, but you can use ZFSguru gnop method to force your pool to be ashift=12 even without using any patched ZFS code, this is the safest route and you should be able to import the array in any Solaris-derivative. I don't think Solaris has a GNOP-alternative.

I had problems importing a FreeBSD pool into OpenIndiana. Are you btw sure ashift=12 is set in FreeBSD using this method?


@Flintstone: with only 4GiB RAM FreeBSD disables prefetching, you may want to enable it in the tuning menu if you want to try again. Any reason for the discrepancy between benchmark and mini-benchmark results? The benchmark scores do show reasonable write throughput. It's perfectly possible the memory management under Solaris-derivatives works much better for ZFS than on FreeBSD. Let's hope that changes for ZFS v28.

4GiB should be sufficient :) OpenIndiana was even running X & GNOME and all sorts of other stuff during my test. Strange that you have to tweak FreeBSD so much. I donno if I'll try FreeBSD again - it was a lot of work to do the test I did yesterday.
 
ashift patch is dangerous, but you can use ZFSguru gnop method to force your pool to be ashift=12 even without using any patched ZFS code, this is the safest route and you should be able to import the array in any Solaris-derivative. I don't think Solaris has a GNOP-alternative.

I thought the gnop method didn't survive reboots? If it does, what you're saying is to do this:
1) Download ZFSguru Live CD
2) Create ZFS array with gnop method, export
3) Boot into OpenIndiana, import

Does that appear to be what you're proposing?
 
I thought the gnop method didn't survive reboots? If it does, what you're saying is to do this:
1) Download ZFSguru Live CD
2) Create ZFS array with gnop method, export
3) Boot into OpenIndiana, import

Does that appear to be what you're proposing?

I tried this and didn't find any sign of the pool when I tried to import in OpenIndiana. Might be a formating issue that can be resolved.

I don't exactly know what the big fear about that modified zpool-12 is all about. When the pool is created you can forget that binary all together. My pool seems to work just fine (my issue above isn't caused by this).

Anyway I'm moving all my stuff now to this array and will keep you posted (about half way there)

Edit:
Code:
NAME    SIZE  ALLOC   FREE    CAP  DEDUP  HEALTH  ALTROOT
bowl   18.1T  17.0T  1.15T    93%  1.00x  ONLINE  -

Running full scrub now again for 3rd time or so - estimated at 9 hrs (outch). Ended up upgrading MB bios (M4N82) from rev 05 to rev 24 - looks like it's a tad bit slower but I imagine a lot more stable... :)
 
Last edited:
Small heads up for you Sub.Mesa:

Santa decided I've been a good boy this year and promised some gifts.
I'm waiting for a Supermicro X8ST3-F and 24 GB ram, and will continue testing various disk configurations when that arrives. Gonna use the onboard LSI1068 with a HP SAS Expander.

Currently the plan is to spend december to build and play around, and then over the newyears to put the system into production. Hopefully this will add to the knowledgebase for your project.
 
I've been following the 4k's state for a while. Finally got down to build a server (Supermicro X8SIA + SASUC8I). It contains 5 WD20EARS 00MVWB0 hdd.

Limiting NCQ as mesa had mentioned returned the best results:

That's very good if I could say myself. Samba's transfer rate to server was around 60-70MB/s. While reading averaged 80MB/s, peaking up to 100MB/s few times.

Gnop only offered an extra 10% of read performance. But write is taking a considerable hit at 4 hdds. Any idea why?


My plan is to go with 4 hdd per set of Raidz. It looks to be the most optimal configuration.
 
I also replied in the other thread, let me quote that to avoid confusion:

Those are very helpful comparative benchmarks, great work! One more request: could you do the 4KSECT override benchmark feature with default vdev queue settings? Just de-select those tuning options (vdev.min_pending and max_pending) to revert to the defaults. Then do the benchmark with 4K sector override.

Generally the 4K sector override appears to improve speeds, but some 4-disk configurations are in trouble, for some reason. We can see the RAID-Z2 write performance being bad below 6 disks; that is a known odd issue which also occured on my 512-byte sector disks. What is interesting is that with 4K sector override the 5-disk RAID-Z2 write speeds went back to normal again; very interesting!

If you can, it would be good to enable NCQ, unless the performance difference is quite big. Your benchmarks show disabling NCQ to help sequential reads, but having a small negative impact on writes instead. If the 4K sector override can make you use normal queue settings and get both decent read/write performance, then that's what i would recommend running.

You may also like to benchmark ZFSguru with ZFS v28 when it is available (around christmas also), would be interesting to see the performance impact.


I've been following the 4k's state for a while. Finally got down to build a server (Supermicro X8SIA + SASUC8I). It contains 5 WD20EARS 00MVWB0 hdd.
Alright this is the newer 3-platter EARS which is faster and has better emulation firmware than the older 4-platter EARS.

Limiting NCQ as mesa had mentioned returned the best results
This may be an unfortunate side-effect of the harddrive's implementation, and WD consumer disks appear to have non-optimal NCQ implementation. Out of my head i can remember Hitachi having better implementations, but time moves fast so this may be out-of-date already. But the effect of queueing highly depends on your disks.

Since this is a system-wide setting, if you limit queueing to 1, you will hurt SSDs alot if you ever want to use them. That's why i recommended to try 4K sector override feature while still having normal queueing settings. This allows you to 'accept the small hit' on NCQ your disks has, while still allowing full queueing on SSDs, which can increase performance by 1000% (10-channels = factor 10.0 versus using only 1 channel = factor 1.0).

That's very good if I could say myself. Samba's transfer rate to server was around 60-70MB/s. While reading averaged 80MB/s, peaking up to 100MB/s few times.
When reading or writing? Could you try mounting the Samba on your (preferably Windows 7) desktop and running CrystalDiskMark on it, or AS SSD. That should give you more accurate testing.

If writes are particularly worse than reads, consider using txg.synctime=1 or 2 tuning option, not included in 'recommended tuning' button.

Gnop only offered an extra 10% of read performance. But write is taking a considerable hit at 4 hdds. Any idea why?
The performance hit at 4 disks is interesting; but please let me see the NCQ enabled 4K sector override tests first, to rule out that NCQ off results in this downward spike. I have no real explanation, though.

The other configurations appear to perform very nicely!

Would be interesting to hear about your new tests, please post them in this thread i think that's best. :D

Cheers!
 
yo!

I see your point about NCQ's system-wide effect. Right now I've one ssd for boot. But I could hardly tell if there's any gain of using one. May replace it with a laptop's hdd. A USB flash with zfs-on-root sounds like an optimal solution, but couldn't get it to work. Will try to provide logs later.

How does gnop work, would the user lose a pool made with gnop? In other words is it going to automatically be applied if:
  • hdd port changed, such as moving it from HBA controller to motherboard (da1 <=> ada1).
  • after fresh system install?

When reading or writing? Could you try mounting the Samba on your (preferably Windows 7) desktop and running CrystalDiskMark on it, or AS SSD. That should give you more accurate testing.
60mb/s writing to server, 80mb/s reading. Tested by copying a 5gb file in Windows 7.

As suggested, used CrystalDiskMark to test some of the configurations. Benchmark results so far:
.

hope that helps. Keep up the good work!
 
Last edited:
Upgraded my server with the following hardware:

Supermicro X8ST3-F
Intel Xeon E5620
16GB ram (will be 24GB when I get the last backorder)

Using HP SAS Expander to connect the 16 Hitachi disks to the onboard LSI1068E SAS controller, so the theoretical 1200MB/s bandwith is my maximum limit.

Benchmarks done with ZFSGuru 0.1.7-preview2e.

My tuning settings:


The results:


Code:
ZFSGURU-benchmark, version 1
Test size: 32.000 gigabytes (GiB)
Test rounds: 1
Cooldown period: 2 seconds
Sector size override: default (no override)
Number of disks: 16 disks
disk 1: gpt/disk01
disk 2: gpt/disk02
disk 3: gpt/disk11
disk 4: gpt/disk12
disk 5: gpt/disk13
disk 6: gpt/disk14
disk 7: gpt/disk15
disk 8: gpt/disk16
disk 9: gpt/disk03
disk 10: gpt/disk04
disk 11: gpt/disk05
disk 12: gpt/disk06
disk 13: gpt/disk07
disk 14: gpt/disk08
disk 15: gpt/disk09
disk 16: gpt/disk10

* Test Settings: TS32; TR1; 
* Tuning: KMEM=15g; AMIN=13g; AMAX=14g; 
* Stopping background processes: sendmail, moused, syslogd and cron
* Stopping Samba service

Now testing RAID0 configuration with 16 disks: cWmRd@
READ:	924 MiB/sec	= 924 MiB/sec avg
WRITE:	622 MiB/sec	= 622 MiB/sec avg

Now testing RAIDZ configuration with 16 disks: cWmRd@
READ:	743 MiB/sec	= 743 MiB/sec avg
WRITE:	573 MiB/sec	= 573 MiB/sec avg

Now testing RAIDZ2 configuration with 16 disks: cWmRd@
READ:	695 MiB/sec	= 695 MiB/sec avg
WRITE:	515 MiB/sec	= 515 MiB/sec avg

Now testing RAID1 configuration with 16 disks: cWmRd@
READ:	885 MiB/sec	= 885 MiB/sec avg
WRITE:	52 MiB/sec	= 52 MiB/sec avg

Now testing RAID1+0 configuration with 16 disks: cWmRd@
READ:	782 MiB/sec	= 782 MiB/sec avg
WRITE:	375 MiB/sec	= 375 MiB/sec avg

Now testing RAIDZ+0 configuration with 8 disks: cWmRd@
READ:	501 MiB/sec	= 501 MiB/sec avg
WRITE:	422 MiB/sec	= 422 MiB/sec avg

Now testing RAIDZ+0 configuration with 12 disks: cWmRd@
READ:	735 MiB/sec	= 735 MiB/sec avg
WRITE:	460 MiB/sec	= 460 MiB/sec avg

Now testing RAIDZ+0 configuration with 16 disks: cWmRd@
READ:	846 MiB/sec	= 846 MiB/sec avg
WRITE:	484 MiB/sec	= 484 MiB/sec avg

Now testing RAIDZ2+0 configuration with 12 disks: cWmRd@
READ:	632 MiB/sec	= 632 MiB/sec avg
WRITE:	413 MiB/sec	= 413 MiB/sec avg

Now testing RAID0 configuration with 12 disks: cWmRd@
READ:	893 MiB/sec	= 893 MiB/sec avg
WRITE:	634 MiB/sec	= 634 MiB/sec avg

Now testing RAID0 configuration with 13 disks: cWmRd@
READ:	928 MiB/sec	= 928 MiB/sec avg
WRITE:	635 MiB/sec	= 635 MiB/sec avg

Now testing RAID0 configuration with 14 disks: cWmRd@
READ:	938 MiB/sec	= 938 MiB/sec avg
WRITE:	671 MiB/sec	= 671 MiB/sec avg

Now testing RAID0 configuration with 15 disks: cWmRd@
READ:	943 MiB/sec	= 943 MiB/sec avg
WRITE:	654 MiB/sec	= 654 MiB/sec avg

Now testing RAIDZ configuration with 12 disks: cWmRd@
READ:	728 MiB/sec	= 728 MiB/sec avg
WRITE:	560 MiB/sec	= 560 MiB/sec avg

Now testing RAIDZ configuration with 13 disks: cWmRd@
READ:	763 MiB/sec	= 763 MiB/sec avg
WRITE:	544 MiB/sec	= 544 MiB/sec avg

Now testing RAIDZ configuration with 14 disks: cWmRd@
READ:	745 MiB/sec	= 745 MiB/sec avg
WRITE:	589 MiB/sec	= 589 MiB/sec avg

Now testing RAIDZ configuration with 15 disks: cWmRd@
READ:	735 MiB/sec	= 735 MiB/sec avg
WRITE:	554 MiB/sec	= 554 MiB/sec avg

Now testing RAIDZ2 configuration with 12 disks: cWmRd@
READ:	659 MiB/sec	= 659 MiB/sec avg
WRITE:	487 MiB/sec	= 487 MiB/sec avg

Now testing RAIDZ2 configuration with 13 disks: cWmRd@
READ:	696 MiB/sec	= 696 MiB/sec avg
WRITE:	475 MiB/sec	= 475 MiB/sec avg

Now testing RAIDZ2 configuration with 14 disks: cWmRd@
READ:	695 MiB/sec	= 695 MiB/sec avg
WRITE:	495 MiB/sec	= 495 MiB/sec avg

Now testing RAIDZ2 configuration with 15 disks: cWmRd@
READ:	697 MiB/sec	= 697 MiB/sec avg
WRITE:	500 MiB/sec	= 500 MiB/sec avg

Now testing RAID1 configuration with 12 disks: cWmRd@
READ:	754 MiB/sec	= 754 MiB/sec avg
WRITE:	68 MiB/sec	= 68 MiB/sec avg

Now testing RAID1 configuration with 13 disks: cWmRd@
READ:	802 MiB/sec	= 802 MiB/sec avg
WRITE:	62 MiB/sec	= 62 MiB/sec avg

Now testing RAID1 configuration with 14 disks: cWmRd@
READ:	775 MiB/sec	= 775 MiB/sec avg
WRITE:	58 MiB/sec	= 58 MiB/sec avg

Now testing RAID1 configuration with 15 disks: cWmRd@
READ:	799 MiB/sec	= 799 MiB/sec avg
WRITE:	55 MiB/sec	= 55 MiB/sec avg

Now testing RAID1+0 configuration with 12 disks: cWmRd@
READ:	562 MiB/sec	= 562 MiB/sec avg
WRITE:	371 MiB/sec	= 371 MiB/sec avg

Now testing RAID1+0 configuration with 14 disks: cWmRd@
READ:	740 MiB/sec	= 740 MiB/sec avg
WRITE:	372 MiB/sec	= 372 MiB/sec avg

Now testing RAIDZ+0 configuration with 8 disks: cWmRd@
READ:	517 MiB/sec	= 846 MiB/sec avg
WRITE:	427 MiB/sec	= 484 MiB/sec avg

Now testing RAIDZ+0 configuration with 12 disks: cWmRd@
READ:	713 MiB/sec	= 846 MiB/sec avg
WRITE:	470 MiB/sec	= 484 MiB/sec avg

Now testing RAIDZ+0 configuration with 16 disks: cWmRd@
READ:	839 MiB/sec	= 839 MiB/sec avg
WRITE:	483 MiB/sec	= 483 MiB/sec avg

Now testing RAIDZ2+0 configuration with 12 disks: cWmRd@
READ:	651 MiB/sec	= 651 MiB/sec avg
WRITE:	431 MiB/sec	= 431 MiB/sec avg

Now testing RAID0 configuration with 8 disks: cWmRd@
READ:	773 MiB/sec	= 773 MiB/sec avg
WRITE:	618 MiB/sec	= 618 MiB/sec avg

Now testing RAID0 configuration with 9 disks: cWmRd@
READ:	840 MiB/sec	= 840 MiB/sec avg
WRITE:	634 MiB/sec	= 634 MiB/sec avg

Now testing RAID0 configuration with 10 disks: cWmRd@
READ:	890 MiB/sec	= 890 MiB/sec avg
WRITE:	638 MiB/sec	= 638 MiB/sec avg

Now testing RAID0 configuration with 11 disks: cWmRd@
READ:	913 MiB/sec	= 913 MiB/sec avg
WRITE:	635 MiB/sec	= 635 MiB/sec avg

Now testing RAIDZ configuration with 8 disks: cWmRd@
READ:	599 MiB/sec	= 599 MiB/sec avg
WRITE:	453 MiB/sec	= 453 MiB/sec avg

Now testing RAIDZ configuration with 9 disks: cWmRd@
READ:	603 MiB/sec	= 603 MiB/sec avg
WRITE:	549 MiB/sec	= 549 MiB/sec avg

Now testing RAIDZ configuration with 10 disks: cWmRd@
READ:	679 MiB/sec	= 679 MiB/sec avg
WRITE:	469 MiB/sec	= 469 MiB/sec avg

Now testing RAIDZ configuration with 11 disks: cWmRd@
READ:	683 MiB/sec	= 683 MiB/sec avg
WRITE:	552 MiB/sec	= 552 MiB/sec avg

Now testing RAIDZ2 configuration with 8 disks: cWmRd@
READ:	538 MiB/sec	= 538 MiB/sec avg
WRITE:	422 MiB/sec	= 422 MiB/sec avg

Now testing RAIDZ2 configuration with 9 disks: cWmRd@
READ:	587 MiB/sec	= 587 MiB/sec avg
WRITE:	454 MiB/sec	= 454 MiB/sec avg

Now testing RAIDZ2 configuration with 10 disks: cWmRd@
READ:	641 MiB/sec	= 641 MiB/sec avg
WRITE:	468 MiB/sec	= 468 MiB/sec avg

Now testing RAIDZ2 configuration with 11 disks: cWmRd@
READ:	650 MiB/sec	= 650 MiB/sec avg
WRITE:	466 MiB/sec	= 466 MiB/sec avg

Now testing RAID1 configuration with 8 disks: cWmRd@
READ:	595 MiB/sec	= 595 MiB/sec avg
WRITE:	96 MiB/sec	= 96 MiB/sec avg

Now testing RAID1 configuration with 9 disks: cWmRd@
READ:	649 MiB/sec	= 649 MiB/sec avg
WRITE:	91 MiB/sec	= 91 MiB/sec avg

Now testing RAID1 configuration with 10 disks: cWmRd@
READ:	708 MiB/sec	= 708 MiB/sec avg
WRITE:	83 MiB/sec	= 83 MiB/sec avg

Now testing RAID1 configuration with 11 disks: cWmRd@
READ:	707 MiB/sec	= 707 MiB/sec avg
WRITE:	74 MiB/sec	= 74 MiB/sec avg

Now testing RAID1+0 configuration with 8 disks: cWmRd@
READ:	433 MiB/sec	= 433 MiB/sec avg
WRITE:	363 MiB/sec	= 363 MiB/sec avg

Now testing RAID1+0 configuration with 10 disks: cWmRd@
READ:	535 MiB/sec	= 535 MiB/sec avg
WRITE:	371 MiB/sec	= 371 MiB/sec avg

Now testing RAIDZ+0 configuration with 8 disks: cWmRd@
READ:	530 MiB/sec	= 839 MiB/sec avg
WRITE:	436 MiB/sec	= 483 MiB/sec avg

Now testing RAIDZ+0 configuration with 12 disks: cWmRd@
READ:	714 MiB/sec	= 839 MiB/sec avg
WRITE:	465 MiB/sec	= 483 MiB/sec avg

Now testing RAIDZ+0 configuration with 16 disks: cWmRd@
READ:	841 MiB/sec	= 841 MiB/sec avg
WRITE:	491 MiB/sec	= 491 MiB/sec avg

Now testing RAIDZ2+0 configuration with 12 disks: cWmRd@
READ:	639 MiB/sec	= 639 MiB/sec avg
WRITE:	414 MiB/sec	= 414 MiB/sec avg

Now testing RAID0 configuration with 4 disks: cWmRd@
READ:	418 MiB/sec	= 418 MiB/sec avg
WRITE:	406 MiB/sec	= 406 MiB/sec avg

Now testing RAID0 configuration with 5 disks: cWmRd@
READ:	514 MiB/sec	= 514 MiB/sec avg
WRITE:	491 MiB/sec	= 491 MiB/sec avg

Now testing RAID0 configuration with 6 disks: cWmRd@
READ:	567 MiB/sec	= 567 MiB/sec avg
WRITE:	552 MiB/sec	= 552 MiB/sec avg

Now testing RAID0 configuration with 7 disks: cWmRd@
READ:	676 MiB/sec	= 676 MiB/sec avg
WRITE:	596 MiB/sec	= 596 MiB/sec avg

Now testing RAIDZ configuration with 4 disks: cWmRd@
READ:	328 MiB/sec	= 328 MiB/sec avg
WRITE:	263 MiB/sec	= 263 MiB/sec avg

Now testing RAIDZ configuration with 5 disks: cWmRd@
READ:	417 MiB/sec	= 417 MiB/sec avg
WRITE:	377 MiB/sec	= 377 MiB/sec avg

Now testing RAIDZ configuration with 6 disks: cWmRd@
READ:	447 MiB/sec	= 447 MiB/sec avg
WRITE:	430 MiB/sec	= 430 MiB/sec avg

Now testing RAIDZ configuration with 7 disks: cWmRd@
READ:	485 MiB/sec	= 485 MiB/sec avg
WRITE:	460 MiB/sec	= 460 MiB/sec avg

Now testing RAIDZ2 configuration with 4 disks: cWmRd@
READ:	226 MiB/sec	= 226 MiB/sec avg
WRITE:	197 MiB/sec	= 197 MiB/sec avg

Now testing RAIDZ2 configuration with 5 disks: cWmRd@
READ:	331 MiB/sec	= 331 MiB/sec avg
WRITE:	247 MiB/sec	= 247 MiB/sec avg

Now testing RAIDZ2 configuration with 6 disks: cWmRd@
READ:	394 MiB/sec	= 394 MiB/sec avg
WRITE:	360 MiB/sec	= 360 MiB/sec avg

Now testing RAIDZ2 configuration with 7 disks: cWmRd@
READ:	481 MiB/sec	= 481 MiB/sec avg
WRITE:	376 MiB/sec	= 376 MiB/sec avg

Now testing RAID1 configuration with 4 disks: cWmRd@
READ:	320 MiB/sec	= 320 MiB/sec avg
WRITE:	110 MiB/sec	= 110 MiB/sec avg

Now testing RAID1 configuration with 5 disks: cWmRd@
READ:	427 MiB/sec	= 427 MiB/sec avg
WRITE:	111 MiB/sec	= 111 MiB/sec avg

Now testing RAID1 configuration with 6 disks: cWmRd@
READ:	480 MiB/sec	= 480 MiB/sec avg
WRITE:	107 MiB/sec	= 107 MiB/sec avg

Now testing RAID1 configuration with 7 disks: cWmRd@
READ:	574 MiB/sec	= 574 MiB/sec avg
WRITE:	108 MiB/sec	= 108 MiB/sec avg

Now testing RAID1+0 configuration with 4 disks: cWmRd@
READ:	229 MiB/sec	= 229 MiB/sec avg
WRITE:	220 MiB/sec	= 220 MiB/sec avg

Now testing RAID1+0 configuration with 6 disks: cWmRd@
READ:	351 MiB/sec	= 351 MiB/sec avg
WRITE:	316 MiB/sec	= 316 MiB/sec avg

Now testing RAIDZ+0 configuration with 8 disks: cWmRd@
READ:	503 MiB/sec	= 328 MiB/sec avg
WRITE:	426 MiB/sec	= 263 MiB/sec avg

Now testing RAIDZ+0 configuration with 12 disks: cWmRd@
READ:	740 MiB/sec	= 328 MiB/sec avg
WRITE:	462 MiB/sec	= 263 MiB/sec avg

Now testing RAIDZ+0 configuration with 16 disks: cWmRd@
READ:	855 MiB/sec	= 328 MiB/sec avg
WRITE:	477 MiB/sec	= 263 MiB/sec avg

Now testing RAIDZ2+0 configuration with 12 disks: cWmRd@
READ:	647 MiB/sec	= 394 MiB/sec avg
WRITE:	433 MiB/sec	= 360 MiB/sec avg

Now testing RAID0 configuration with 1 disks: cWmRd@
READ:	112 MiB/sec	= 112 MiB/sec avg
WRITE:	114 MiB/sec	= 114 MiB/sec avg

Now testing RAID0 configuration with 2 disks: cWmRd@
READ:	228 MiB/sec	= 228 MiB/sec avg
WRITE:	215 MiB/sec	= 215 MiB/sec avg

Now testing RAID0 configuration with 3 disks: cWmRd@
READ:	334 MiB/sec	= 334 MiB/sec avg
WRITE:	339 MiB/sec	= 339 MiB/sec avg

Now testing RAIDZ configuration with 2 disks: cWmRd@
READ:	116 MiB/sec	= 116 MiB/sec avg
WRITE:	109 MiB/sec	= 109 MiB/sec avg

Now testing RAIDZ configuration with 3 disks: cWmRd@
READ:	222 MiB/sec	= 222 MiB/sec avg
WRITE:	210 MiB/sec	= 210 MiB/sec avg

Now testing RAIDZ2 configuration with 3 disks: cWmRd@
READ:	116 MiB/sec	= 116 MiB/sec avg
WRITE:	106 MiB/sec	= 106 MiB/sec avg

Now testing RAID1 configuration with 2 disks: cWmRd@
READ:	115 MiB/sec	= 115 MiB/sec avg
WRITE:	114 MiB/sec	= 114 MiB/sec avg

Now testing RAID1 configuration with 3 disks: cWmRd@
READ:	245 MiB/sec	= 245 MiB/sec avg
WRITE:	109 MiB/sec	= 109 MiB/sec avg

Now testing RAIDZ+0 configuration with 8 disks: cWmRd@
READ:	490 MiB/sec	= 328 MiB/sec avg
WRITE:	426 MiB/sec	= 263 MiB/sec avg

Now testing RAIDZ+0 configuration with 12 disks: cWmRd@
READ:	740 MiB/sec	= 328 MiB/sec avg
WRITE:	478 MiB/sec	= 263 MiB/sec avg

Now testing RAIDZ+0 configuration with 16 disks: cWmRd@
READ:	859 MiB/sec	= 328 MiB/sec avg
WRITE:	463 MiB/sec	= 263 MiB/sec avg

Now testing RAIDZ2+0 configuration with 12 disks: cWmRd@
READ:	650 MiB/sec	= 394 MiB/sec avg
WRITE:	414 MiB/sec	= 360 MiB/sec avg

Done
 
I have some serious problems with my setup. Copy to the drives works great (did 6 TB - no errors in zpool status) - but whenever I scrub I get errors - on ALL drives - and lots of them. Tested changing the speed to 150 and still the same problem. Never seen this before... AOC-USAS-L8I and F4EG compatibility problem?

This is scary...

Just for the benefit of everyone reading this thread. The problem here was more than likely a serious firmware bug in the F4EG drives, and not a problem with either Nexenta or the AOC-USAS-L8I. I have patched my drives but haven't confirmed this 100% yet, though it seems like this was my problem. There is another thread on this forum discussing this issue.
 
The firmware issue on F4 is indeed a nasty one; good that ZFS at least detects this kind of corruption, and repairs it on the spot.

Data corruption on HDDs is very bad, but Samsung did release a firmware fix within days of this incident, which is commendable. I can remember firmware issues from Seagate that took months to fix.
 
Hi I just destroyed a 8 disk raidz2 (wd20ears using 4k sector override) and added another 2 disks (also wd20ears). Now when running the zfsguru benchmark without sector override I notice that the write speed for 10 disk raidz2 dropped with more than half compared to 8 and 9 disks. Does anyone have any idea as to why this is happening? And where to start looking, Could one of the new drives be the cause? I will do some more testing when I get back from work.
Code:
ZFSGURU-benchmark, version 1
Test size: 32.000 gigabytes (GiB)
Test rounds: 1
Cooldown period: 2 seconds
Sector size override: default (no override)
Number of disks: 10 disks
disk 1: label/disk01
disk 2: label/disk02
disk 3: label/disk03
disk 4: label/disk04
disk 5: label/disk05
disk 6: label/disk06
disk 7: label/disk07
disk 8: label/disk08
disk 9: label/disk09
disk 10: label/disk10

* Test Settings: TS32; TR1; 
* Tuning: KMEM=11.6g; AMIN=3.9g; AMAX=5.8g; 
* Stopping background processes: sendmail, moused, syslogd and cron
* Stopping Samba service

Now testing RAID0 configuration with 8 disks: cWmRzmId@
READ:	335 MiB/sec	= 335 MiB/sec avg
WRITE:	475 MiB/sec	= 475 MiB/sec avg
raidtest.read:	82	= 82 IOps ( ~5412 KiB/sec )
raidtest.write:	116	= 116 IOps ( ~7656 KiB/sec )
raidtest.mixed:	122	= 122 IOps ( ~8052 KiB/sec )

Now testing RAID0 configuration with 9 disks: cWmRzmId@
READ:	444 MiB/sec	= 444 MiB/sec avg
WRITE:	468 MiB/sec	= 468 MiB/sec avg
raidtest.read:	74	= 74 IOps ( ~4884 KiB/sec )
raidtest.write:	111	= 111 IOps ( ~7326 KiB/sec )
raidtest.mixed:	122	= 122 IOps ( ~8052 KiB/sec )

Now testing RAID0 configuration with 10 disks: cWmRzmId@
READ:	454 MiB/sec	= 454 MiB/sec avg
WRITE:	504 MiB/sec	= 504 MiB/sec avg
raidtest.read:	83	= 83 IOps ( ~5478 KiB/sec )
raidtest.write:	120	= 120 IOps ( ~7920 KiB/sec )
raidtest.mixed:	132	= 132 IOps ( ~8712 KiB/sec )

Now testing RAIDZ configuration with 8 disks: cWmRzmId@
READ:	499 MiB/sec	= 499 MiB/sec avg
WRITE:	88 MiB/sec	= 88 MiB/sec avg
raidtest.read:	71	= 71 IOps ( ~4686 KiB/sec )
raidtest.write:	63	= 63 IOps ( ~4158 KiB/sec )
raidtest.mixed:	59	= 59 IOps ( ~3894 KiB/sec )

Now testing RAIDZ configuration with 9 disks: cWmRzmId@
READ:	275 MiB/sec	= 275 MiB/sec avg
WRITE:	351 MiB/sec	= 351 MiB/sec avg
raidtest.read:	69	= 69 IOps ( ~4554 KiB/sec )
raidtest.write:	79	= 79 IOps ( ~5214 KiB/sec )
raidtest.mixed:	80	= 80 IOps ( ~5280 KiB/sec )

Now testing RAIDZ configuration with 10 disks: cWmRzmId@
READ:	537 MiB/sec	= 537 MiB/sec avg
WRITE:	110 MiB/sec	= 110 MiB/sec avg
raidtest.read:	67	= 67 IOps ( ~4422 KiB/sec )
raidtest.write:	77	= 77 IOps ( ~5082 KiB/sec )
raidtest.mixed:	74	= 74 IOps ( ~4884 KiB/sec )

Now testing RAIDZ2 configuration with 8 disks: cWmRzmId@
READ:	401 MiB/sec	= 401 MiB/sec avg
WRITE:	274 MiB/sec	= 274 MiB/sec avg
raidtest.read:	73	= 73 IOps ( ~4818 KiB/sec )
raidtest.write:	67	= 67 IOps ( ~4422 KiB/sec )
raidtest.mixed:	60	= 60 IOps ( ~3960 KiB/sec )

Now testing RAIDZ2 configuration with 9 disks: cWmRzmId@
READ:	363 MiB/sec	= 363 MiB/sec avg
WRITE:	290 MiB/sec	= 290 MiB/sec avg
raidtest.read:	68	= 68 IOps ( ~4488 KiB/sec )
raidtest.write:	61	= 61 IOps ( ~4026 KiB/sec )
raidtest.mixed:	61	= 61 IOps ( ~4026 KiB/sec )

Now testing RAIDZ2 configuration with 10 disks: cWmRzmId@
READ:	597 MiB/sec	= 597 MiB/sec avg
WRITE:	132 MiB/sec	= 132 MiB/sec avg
raidtest.read:	69	= 69 IOps ( ~4554 KiB/sec )
raidtest.write:	74	= 74 IOps ( ~4884 KiB/sec )
raidtest.mixed:	64	= 64 IOps ( ~4224 KiB/sec )

Now testing RAID1 configuration with 8 disks: cWmRzmId@
READ:	339 MiB/sec	= 339 MiB/sec avg
WRITE:	84 MiB/sec	= 84 MiB/sec avg
raidtest.read:	50	= 50 IOps ( ~3300 KiB/sec )
raidtest.write:	71	= 71 IOps ( ~4686 KiB/sec )
raidtest.mixed:	72	= 72 IOps ( ~4752 KiB/sec )

Now testing RAID1 configuration with 9 disks: cWmRzmId@
READ:	449 MiB/sec	= 449 MiB/sec avg
WRITE:	86 MiB/sec	= 86 MiB/sec avg
raidtest.read:	51	= 51 IOps ( ~3366 KiB/sec )
raidtest.write:	72	= 72 IOps ( ~4752 KiB/sec )
raidtest.mixed:	76	= 76 IOps ( ~5016 KiB/sec )

Now testing RAID1 configuration with 10 disks: cWmRzmId@
READ:	477 MiB/sec	= 477 MiB/sec avg
WRITE:	84 MiB/sec	= 84 MiB/sec avg
raidtest.read:	67	= 67 IOps ( ~4422 KiB/sec )
raidtest.write:	94	= 94 IOps ( ~6204 KiB/sec )
raidtest.mixed:	100	= 100 IOps ( ~6600 KiB/sec )

Now testing RAID1+0 configuration with 8 disks: cWmRzmId@
READ:	294 MiB/sec	= 294 MiB/sec avg
WRITE:	286 MiB/sec	= 286 MiB/sec avg
raidtest.read:	81	= 81 IOps ( ~5346 KiB/sec )
raidtest.write:	108	= 108 IOps ( ~7128 KiB/sec )
raidtest.mixed:	111	= 111 IOps ( ~7326 KiB/sec )

Now testing RAID1+0 configuration with 10 disks: cWmRzmId@
READ:	341 MiB/sec	= 341 MiB/sec avg
WRITE:	340 MiB/sec	= 340 MiB/sec avg
raidtest.read:	92	= 92 IOps ( ~6072 KiB/sec )
raidtest.write:	115	= 115 IOps ( ~7590 KiB/sec )
raidtest.mixed:	123	= 123 IOps ( ~8118 KiB/sec )

Now testing RAIDZ+0 configuration with 8 disks: cWmRzmId@
READ:	306 MiB/sec	= 306 MiB/sec avg
WRITE:	333 MiB/sec	= 333 MiB/sec avg
raidtest.read:	77	= 77 IOps ( ~5082 KiB/sec )
raidtest.write:	89	= 89 IOps ( ~5874 KiB/sec )
raidtest.mixed:	91	= 91 IOps ( ~6006 KiB/sec )
 
How are your disks connected? Do they have full bandwidth? If you're using PCI-X or PCI i would understand these results; not if you use full bandwidth SATA.

The 10-disk RAID-Z2 should give you very good results instead! What about RAID1/mirroring sequential write; does that line keep horizontal or does it drop to lower speeds? This usually is quite effective in determining interface bottlenecks; if the RAID1 scales with factor 1.0, meaning it will keep the same sequential write no matter howmany disks you add, then your interface is perfect.

What speeds you get with the sectorsize override feature?
 
All disks are connected through 2 IBM br10i ServeRAID (LSI1068E) using pci-e. I can't check right now but the MB has two 16x pci-e slots and I belive it should be able to do 8x on booth adapters when using booth slots. I will try running benchmark with sector override again and maybe test the disks in smaller groups or even one at a time. I will try to post the plots from the tests when this is done.

Thanks for your help.
/Martin
 
Perhaps you want to do a benchmark both with the sectorsize override and without. The benchmark charts would also be nice. :)

Also realise that if one (or more) disks in your pool perform much less than the others, you would see this in particularly RAID-Z/2 benchmarks since these involve all disks in a single I/O operation. A common issue is that one of the disks is a 'dud' that is underperforming. Could be another issue of course, but this might be worth investigating.
 
Hi!
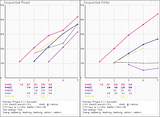
These are the graphs from yesterdays run:


I started another benchmark, this time using 4k override, looking a lot better this far but it would be interesting to know why the writes is so slow at 10 disks without the sector override.
Code:
Now testing RAIDZ2 configuration with 10 disks: cWmRzmId@
READ:	538 MiB/sec	= 538 MiB/sec avg
WRITE:	323 MiB/sec	= 323 MiB/sec avg
raidtest.read:	68	= 68 IOps ( ~4488 KiB/sec )
raidtest.write:	90	= 90 IOps ( ~5940 KiB/sec )
raidtest.mixed:	90	= 90 IOps ( ~5940 KiB/sec )

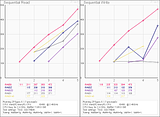
I will post the new graphs when when the benchmark is done with the 10 disk raid1.
 
These are the charts using 4k sector override:

Code:
ZFSGURU-benchmark, version 1
Test size: 32.000 gigabytes (GiB)
Test rounds: 1
Cooldown period: 2 seconds
Sector size override: 4096 bytes
Number of disks: 10 disks
disk 1: label/disk01.nop
disk 2: label/disk02.nop
disk 3: label/disk03.nop
disk 4: label/disk04.nop
disk 5: label/disk05.nop
disk 6: label/disk06.nop
disk 7: label/disk07.nop
disk 8: label/disk08.nop
disk 9: label/disk09.nop
disk 10: label/disk10.nop

* Test Settings: TS32; TR1; SECT4096; 
* Tuning: KMEM=11.6g; AMIN=3.9g; AMAX=5.8g; 
* Stopping background processes: sendmail, moused, syslogd and cron
* Stopping Samba service

Now testing RAID0 configuration with 8 disks: cWmRzmId@
READ:	453 MiB/sec	= 453 MiB/sec avg
WRITE:	504 MiB/sec	= 504 MiB/sec avg
raidtest.read:	85	= 85 IOps ( ~5610 KiB/sec )
raidtest.write:	117	= 117 IOps ( ~7722 KiB/sec )
raidtest.mixed:	131	= 131 IOps ( ~8646 KiB/sec )

Now testing RAID0 configuration with 9 disks: cWmRzmId@
READ:	532 MiB/sec	= 532 MiB/sec avg
WRITE:	542 MiB/sec	= 542 MiB/sec avg
raidtest.read:	91	= 91 IOps ( ~6006 KiB/sec )
raidtest.write:	122	= 122 IOps ( ~8052 KiB/sec )
raidtest.mixed:	132	= 132 IOps ( ~8712 KiB/sec )

Now testing RAID0 configuration with 10 disks: cWmRzmId@
READ:	595 MiB/sec	= 595 MiB/sec avg
WRITE:	592 MiB/sec	= 592 MiB/sec avg
raidtest.read:	86	= 86 IOps ( ~5676 KiB/sec )
raidtest.write:	122	= 122 IOps ( ~8052 KiB/sec )
raidtest.mixed:	135	= 135 IOps ( ~8910 KiB/sec )

Now testing RAIDZ configuration with 8 disks: cWmRzmId@
READ:	480 MiB/sec	= 480 MiB/sec avg
WRITE:	292 MiB/sec	= 292 MiB/sec avg
raidtest.read:	79	= 79 IOps ( ~5214 KiB/sec )
raidtest.write:	100	= 100 IOps ( ~6600 KiB/sec )
raidtest.mixed:	102	= 102 IOps ( ~6732 KiB/sec )

Now testing RAIDZ configuration with 9 disks: cWmRzmId@
READ:	362 MiB/sec	= 362 MiB/sec avg
WRITE:	453 MiB/sec	= 453 MiB/sec avg
raidtest.read:	72	= 72 IOps ( ~4752 KiB/sec )
raidtest.write:	92	= 92 IOps ( ~6072 KiB/sec )
raidtest.mixed:	93	= 93 IOps ( ~6138 KiB/sec )

Now testing RAIDZ configuration with 10 disks: cWmRzmId@
READ:	462 MiB/sec	= 462 MiB/sec avg
WRITE:	488 MiB/sec	= 488 MiB/sec avg
raidtest.read:	74	= 74 IOps ( ~4884 KiB/sec )
raidtest.write:	90	= 90 IOps ( ~5940 KiB/sec )
raidtest.mixed:	92	= 92 IOps ( ~6072 KiB/sec )

Now testing RAIDZ2 configuration with 8 disks: cWmRzmId@
READ:	465 MiB/sec	= 465 MiB/sec avg
WRITE:	276 MiB/sec	= 276 MiB/sec avg
raidtest.read:	68	= 68 IOps ( ~4488 KiB/sec )
raidtest.write:	90	= 90 IOps ( ~5940 KiB/sec )
raidtest.mixed:	89	= 89 IOps ( ~5874 KiB/sec )

Now testing RAIDZ2 configuration with 9 disks: cWmRzmId@
READ:	375 MiB/sec	= 375 MiB/sec avg
WRITE:	422 MiB/sec	= 422 MiB/sec avg
raidtest.read:	76	= 76 IOps ( ~5016 KiB/sec )
raidtest.write:	84	= 84 IOps ( ~5544 KiB/sec )
raidtest.mixed:	87	= 87 IOps ( ~5742 KiB/sec )

Now testing RAIDZ2 configuration with 10 disks: cWmRzmId@
READ:	534 MiB/sec	= 534 MiB/sec avg
WRITE:	321 MiB/sec	= 321 MiB/sec avg
raidtest.read:	68	= 68 IOps ( ~4488 KiB/sec )
raidtest.write:	89	= 89 IOps ( ~5874 KiB/sec )
raidtest.mixed:	90	= 90 IOps ( ~5940 KiB/sec )

Now testing RAID1 configuration with 8 disks: cWmRzmId@
READ:	374 MiB/sec	= 374 MiB/sec avg
WRITE:	92 MiB/sec	= 92 MiB/sec avg
raidtest.read:	68	= 68 IOps ( ~4488 KiB/sec )
raidtest.write:	92	= 92 IOps ( ~6072 KiB/sec )
raidtest.mixed:	99	= 99 IOps ( ~6534 KiB/sec )

Now testing RAID1 configuration with 9 disks: cWmRzmId@
READ:	525 MiB/sec	= 525 MiB/sec avg
WRITE:	91 MiB/sec	= 91 MiB/sec avg
raidtest.read:	69	= 69 IOps ( ~4554 KiB/sec )
raidtest.write:	95	= 95 IOps ( ~6270 KiB/sec )
raidtest.mixed:	110	= 110 IOps ( ~7260 KiB/sec )

Now testing RAID1 configuration with 10 disks: cWmRzmId@
READ:	531 MiB/sec	= 531 MiB/sec avg
WRITE:	91 MiB/sec	= 91 MiB/sec avg
raidtest.read:	99	= 99 IOps ( ~6534 KiB/sec )
raidtest.write:	108	= 108 IOps ( ~7128 KiB/sec )
raidtest.mixed:	109	= 109 IOps ( ~7194 KiB/sec )

Now testing RAID1+0 configuration with 8 disks: cWmRzmId@
READ:	410 MiB/sec	= 410 MiB/sec avg
WRITE:	306 MiB/sec	= 306 MiB/sec avg
raidtest.read:	83	= 83 IOps ( ~5478 KiB/sec )
raidtest.write:	113	= 113 IOps ( ~7458 KiB/sec )
raidtest.mixed:	117	= 117 IOps ( ~7722 KiB/sec )

Now testing RAID1+0 configuration with 10 disks: cWmRzmId@
READ:	484 MiB/sec	= 484 MiB/sec avg
WRITE:	363 MiB/sec	= 363 MiB/sec avg
raidtest.read:	102	= 102 IOps ( ~6732 KiB/sec )
raidtest.write:	122	= 122 IOps ( ~8052 KiB/sec )
raidtest.mixed:	128	= 128 IOps ( ~8448 KiB/sec )

Now testing RAIDZ+0 configuration with 8 disks: cWmRzmId@
READ:	393 MiB/sec	= 393 MiB/sec avg
WRITE:	250 MiB/sec	= 250 MiB/sec avg
raidtest.read:	82	= 82 IOps ( ~5412 KiB/sec )
raidtest.write:	105	= 105 IOps ( ~6930 KiB/sec )
raidtest.mixed:	106	= 106 IOps ( ~6996 KiB/sec )

Now testing RAID0 configuration with 4 disks: cWmRzmId@
READ:	293 MiB/sec	= 293 MiB/sec avg
WRITE:	308 MiB/sec	= 308 MiB/sec avg
raidtest.read:	98	= 98 IOps ( ~6468 KiB/sec )
raidtest.write:	112	= 112 IOps ( ~7392 KiB/sec )
raidtest.mixed:	118	= 118 IOps ( ~7788 KiB/sec )

Now testing RAID0 configuration with 5 disks: cWmRzmId@
READ:	333 MiB/sec	= 333 MiB/sec avg
WRITE:	365 MiB/sec	= 365 MiB/sec avg
raidtest.read:	92	= 92 IOps ( ~6072 KiB/sec )
raidtest.write:	113	= 113 IOps ( ~7458 KiB/sec )
raidtest.mixed:	123	= 123 IOps ( ~8118 KiB/sec )

Now testing RAID0 configuration with 6 disks: cWmRzmId@
READ:	398 MiB/sec	= 398 MiB/sec avg
WRITE:	416 MiB/sec	= 416 MiB/sec avg
raidtest.read:	103	= 103 IOps ( ~6798 KiB/sec )
raidtest.write:	121	= 121 IOps ( ~7986 KiB/sec )
raidtest.mixed:	128	= 128 IOps ( ~8448 KiB/sec )

Now testing RAID0 configuration with 7 disks: cWmRzmId@
READ:	457 MiB/sec	= 457 MiB/sec avg
WRITE:	465 MiB/sec	= 465 MiB/sec avg
raidtest.read:	92	= 92 IOps ( ~6072 KiB/sec )
raidtest.write:	120	= 120 IOps ( ~7920 KiB/sec )
raidtest.mixed:	127	= 127 IOps ( ~8382 KiB/sec )

Now testing RAIDZ configuration with 4 disks: cWmRzmId@
READ:	230 MiB/sec	= 230 MiB/sec avg
WRITE:	145 MiB/sec	= 145 MiB/sec avg
raidtest.read:	85	= 85 IOps ( ~5610 KiB/sec )
raidtest.write:	100	= 100 IOps ( ~6600 KiB/sec )
raidtest.mixed:	100	= 100 IOps ( ~6600 KiB/sec )

Now testing RAIDZ configuration with 5 disks: cWmRzmId@
READ:	210 MiB/sec	= 210 MiB/sec avg
WRITE:	297 MiB/sec	= 297 MiB/sec avg
raidtest.read:	55	= 55 IOps ( ~3630 KiB/sec )
raidtest.write:	80	= 80 IOps ( ~5280 KiB/sec )
raidtest.mixed:	88	= 88 IOps ( ~5808 KiB/sec )

Now testing RAIDZ configuration with 6 disks: cWmRzmId@
READ:	353 MiB/sec	= 353 MiB/sec avg
WRITE:	227 MiB/sec	= 227 MiB/sec avg
raidtest.read:	71	= 71 IOps ( ~4686 KiB/sec )
raidtest.write:	89	= 89 IOps ( ~5874 KiB/sec )
raidtest.mixed:	90	= 90 IOps ( ~5940 KiB/sec )

Now testing RAIDZ configuration with 7 disks: cWmRzmId@
READ:	413 MiB/sec	= 413 MiB/sec avg
WRITE:	388 MiB/sec	= 388 MiB/sec avg
raidtest.read:	73	= 73 IOps ( ~4818 KiB/sec )
raidtest.write:	93	= 93 IOps ( ~6138 KiB/sec )
raidtest.mixed:	92	= 92 IOps ( ~6072 KiB/sec )

Now testing RAIDZ2 configuration with 4 disks: cWmRzmId@
READ:	162 MiB/sec	= 162 MiB/sec avg
WRITE:	111 MiB/sec	= 111 MiB/sec avg
raidtest.read:	52	= 52 IOps ( ~3432 KiB/sec )
raidtest.write:	72	= 72 IOps ( ~4752 KiB/sec )
raidtest.mixed:	84	= 84 IOps ( ~5544 KiB/sec )

Now testing RAIDZ2 configuration with 5 disks: cWmRzmId@
READ:	244 MiB/sec	= 244 MiB/sec avg
WRITE:	232 MiB/sec	= 232 MiB/sec avg
raidtest.read:	62	= 62 IOps ( ~4092 KiB/sec )
raidtest.write:	84	= 84 IOps ( ~5544 KiB/sec )
raidtest.mixed:	84	= 84 IOps ( ~5544 KiB/sec )

Now testing RAIDZ2 configuration with 6 disks: cWmRzmId@
READ:	223 MiB/sec	= 223 MiB/sec avg
WRITE:	296 MiB/sec	= 296 MiB/sec avg
raidtest.read:	70	= 70 IOps ( ~4620 KiB/sec )
raidtest.write:	93	= 93 IOps ( ~6138 KiB/sec )
raidtest.mixed:	100	= 100 IOps ( ~6600 KiB/sec )

Now testing RAIDZ2 configuration with 7 disks: cWmRzmId@
READ:	403 MiB/sec	= 403 MiB/sec avg
WRITE:	230 MiB/sec	= 230 MiB/sec avg
raidtest.read:	68	= 68 IOps ( ~4488 KiB/sec )
raidtest.write:	89	= 89 IOps ( ~5874 KiB/sec )
raidtest.mixed:	89	= 89 IOps ( ~5874 KiB/sec )

Now testing RAID1 configuration with 4 disks: cWmRzmId@
READ:	269 MiB/sec	= 269 MiB/sec avg
WRITE:	92 MiB/sec	= 92 MiB/sec avg
raidtest.read:	50	= 50 IOps ( ~3300 KiB/sec )
raidtest.write:	69	= 69 IOps ( ~4554 KiB/sec )
raidtest.mixed:	74	= 74 IOps ( ~4884 KiB/sec )

Now testing RAID1 configuration with 5 disks: cWmRzmId@
READ:	321 MiB/sec	= 321 MiB/sec avg
WRITE:	88 MiB/sec	= 88 MiB/sec avg
raidtest.read:	57	= 57 IOps ( ~3762 KiB/sec )
raidtest.write:	71	= 71 IOps ( ~4686 KiB/sec )
raidtest.mixed:	76	= 76 IOps ( ~5016 KiB/sec )

Now testing RAID1 configuration with 6 disks: cWmRzmId@
READ:	387 MiB/sec	= 387 MiB/sec avg
WRITE:	91 MiB/sec	= 91 MiB/sec avg
raidtest.read:	98	= 98 IOps ( ~6468 KiB/sec )
raidtest.write:	102	= 102 IOps ( ~6732 KiB/sec )
raidtest.mixed:	101	= 101 IOps ( ~6666 KiB/sec )

Now testing RAID1 configuration with 7 disks: cWmRzmId@
READ:	484 MiB/sec	= 484 MiB/sec avg
WRITE:	91 MiB/sec	= 91 MiB/sec avg
raidtest.read:	68	= 68 IOps ( ~4488 KiB/sec )
raidtest.write:	91	= 91 IOps ( ~6006 KiB/sec )
raidtest.mixed:	100	= 100 IOps ( ~6600 KiB/sec )

Now testing RAID1+0 configuration with 4 disks: cWmRzmId@
READ:	246 MiB/sec	= 246 MiB/sec avg
WRITE:	172 MiB/sec	= 172 MiB/sec avg
raidtest.read:	96	= 96 IOps ( ~6336 KiB/sec )
raidtest.write:	108	= 108 IOps ( ~7128 KiB/sec )
raidtest.mixed:	111	= 111 IOps ( ~7326 KiB/sec )

Now testing RAID1+0 configuration with 6 disks: cWmRzmId@
READ:	356 MiB/sec	= 356 MiB/sec avg
WRITE:	245 MiB/sec	= 245 MiB/sec avg
raidtest.read:	90	= 90 IOps ( ~5940 KiB/sec )
raidtest.write:	113	= 113 IOps ( ~7458 KiB/sec )
raidtest.mixed:	120	= 120 IOps ( ~7920 KiB/sec )

Now testing RAIDZ+0 configuration with 8 disks: cWmRzmId@
READ:	406 MiB/sec	= 230 MiB/sec avg
WRITE:	246 MiB/sec	= 145 MiB/sec avg
raidtest.read:	84	= 85 IOps ( ~5610 KiB/sec )
raidtest.write:	104	= 100 IOps ( ~6600 KiB/sec )
raidtest.mixed:	102	= 100 IOps ( ~6600 KiB/sec )

Now testing RAID0 configuration with 1 disks: cWmRzmId@
READ:	101 MiB/sec	= 101 MiB/sec avg
WRITE:	96 MiB/sec	= 96 MiB/sec avg
raidtest.read:	82	= 82 IOps ( ~5412 KiB/sec )
raidtest.write:	96	= 96 IOps ( ~6336 KiB/sec )
raidtest.mixed:	104	= 104 IOps ( ~6864 KiB/sec )

Now testing RAID0 configuration with 2 disks: cWmRzmId@
READ:	167 MiB/sec	= 167 MiB/sec avg
WRITE:	177 MiB/sec	= 177 MiB/sec avg
raidtest.read:	86	= 86 IOps ( ~5676 KiB/sec )
raidtest.write:	102	= 102 IOps ( ~6732 KiB/sec )
raidtest.mixed:	108	= 108 IOps ( ~7128 KiB/sec )

Now testing RAID0 configuration with 3 disks: cWmRzmId@
READ:	233 MiB/sec	= 233 MiB/sec avg
WRITE:	244 MiB/sec	= 244 MiB/sec avg
raidtest.read:	84	= 84 IOps ( ~5544 KiB/sec )
raidtest.write:	106	= 106 IOps ( ~6996 KiB/sec )
raidtest.mixed:	113	= 113 IOps ( ~7458 KiB/sec )

Now testing RAIDZ configuration with 2 disks: cWmRzmId@
READ:	95 MiB/sec	= 95 MiB/sec avg
WRITE:	92 MiB/sec	= 92 MiB/sec avg
raidtest.read:	62	= 62 IOps ( ~4092 KiB/sec )
raidtest.write:	92	= 92 IOps ( ~6072 KiB/sec )
raidtest.mixed:	99	= 99 IOps ( ~6534 KiB/sec )

Now testing RAIDZ configuration with 3 disks: cWmRzmId@
READ:	145 MiB/sec	= 145 MiB/sec avg
WRITE:	168 MiB/sec	= 168 MiB/sec avg
raidtest.read:	72	= 72 IOps ( ~4752 KiB/sec )
raidtest.write:	84	= 84 IOps ( ~5544 KiB/sec )
raidtest.mixed:	85	= 85 IOps ( ~5610 KiB/sec )

Now testing RAIDZ2 configuration with 3 disks: cWmRzmId@
READ:	98 MiB/sec	= 98 MiB/sec avg
WRITE:	90 MiB/sec	= 90 MiB/sec avg
raidtest.read:	62	= 62 IOps ( ~4092 KiB/sec )
raidtest.write:	91	= 91 IOps ( ~6006 KiB/sec )
raidtest.mixed:	99	= 99 IOps ( ~6534 KiB/sec )

Now testing RAID1 configuration with 2 disks: cWmRzmId@
READ:	136 MiB/sec	= 136 MiB/sec avg
WRITE:	93 MiB/sec	= 93 MiB/sec avg
raidtest.read:	97	= 97 IOps ( ~6402 KiB/sec )
raidtest.write:	99	= 99 IOps ( ~6534 KiB/sec )
raidtest.mixed:	101	= 101 IOps ( ~6666 KiB/sec )

Now testing RAID1 configuration with 3 disks: cWmRzmId@
READ:	211 MiB/sec	= 211 MiB/sec avg
WRITE:	91 MiB/sec	= 91 MiB/sec avg
raidtest.read:	98	= 98 IOps ( ~6468 KiB/sec )
raidtest.write:	101	= 101 IOps ( ~6666 KiB/sec )
raidtest.mixed:	100	= 100 IOps ( ~6600 KiB/sec )

Now testing RAIDZ+0 configuration with 8 disks: cWmRzmId@
READ:	398 MiB/sec	= 230 MiB/sec avg
WRITE:	249 MiB/sec	= 145 MiB/sec avg
raidtest.read:	80	= 85 IOps ( ~5610 KiB/sec )
raidtest.write:	97	= 100 IOps ( ~6600 KiB/sec )
raidtest.mixed:	104	= 100 IOps ( ~6600 KiB/sec )

Done
I'm satisfied with the performance and will probably run it like this. Are there any other tweaks worth trying? This pool on the server will only host media files for my htpc:s. For now I'm booting from USB and zfsonroot, I will later add a 2 disk mirror and install zfsonroot. the mirror will also be used as backup/storage for the other clients on the network. Is this a good idea you think?

Happy New Year!
Martin S.
 
Those are interesting yet unexpected results. The Sectorsize Override feature is still new and not that many benchmarks available; testing the performance with and without might be worthwhile to find the ideal configuration on your system. Yet i would prefer to see more systems with the benchmarks you did to see if we can see common trends. The first benchmarks you posted were without the sectorsize override?

Also, did you reboot after performing tuning? I can see you did tuning but i can't see kmem increasing. This might also have to do with the new memory tuning that went into preview3; so this could be either not having reboot after doing tuning, or an issue still with my new memory tuning.

That said, the configurations that do perform well show excellent performance. If you can use such an optimal configuration that runs well on your system, you should have excellent performance. Still you can find out whether those 'sub-optimal' configurations could be improved.
 
Yes the first test was done without 4k override, upgrade to webgui 0.1.7-p3 and tuning using "reset to recommended values" was done before installing the last 2 disks so in that respect booth tests was identical besides the sector override. Reboot was also done after each test. I have started testing the new disks individually to see if one is performs different as you mentioned.
Is there anything you think I should try regarding tuning when the single disk tests are done and hopefully shows that the disks are OK?

Martin S
 
. Yet i would prefer to see more systems with the benchmarks you did to see if we can see common trends.

I've almost finished building a new box which is basically going to become a permanent testing platform, so I'll run a bunch of tests and see how they compare. :)

The hardware should be more than capable of dealing with anything that gets thrown at it [Xeon 5500 with 8GB ECC DDR3], so it'll be interesting to see how things perform.

EDIT: I might also see about picking up one of the LSISAS2008 cards and running a few tests with that under BSD9.

I've got a few 30GB OCZ Vertex SSDs lying around the place as well, so it might be fun to throw them in and what sort of results I can get ... just for shits and giggles.
 
Last edited:
Benches from my system, running with 6x 2TB Samsung F4s, a x3440 with 8G of RAM on a Supermicro X8SI6-F.

512 default sector size:
Code:
ZFSGURU-benchmark, version 1
Test size: 16.000 gigabytes (GiB)
Test rounds: 2
Cooldown period: 2 seconds
Sector size override: default (no override)
Number of disks: 6 disks
disk 1: label/0
disk 2: label/1
disk 3: label/2
disk 4: label/3
disk 5: label/4
disk 6: label/5

* Test Settings: TS16; TR2; 
* Tuning: none
* Stopping background processes: sendmail, moused, syslogd and cron
* Stopping Samba service

Now testing RAID0 configuration with 4 disks: cWmRd@cWmRd@
READ:	415 MiB/sec	426 MiB/sec	= 421 MiB/sec avg
WRITE:	417 MiB/sec	435 MiB/sec	= 426 MiB/sec avg

Now testing RAID0 configuration with 5 disks: cWmRd@cWmRd@
READ:	532 MiB/sec	514 MiB/sec	= 523 MiB/sec avg
WRITE:	556 MiB/sec	566 MiB/sec	= 561 MiB/sec avg

Now testing RAID0 configuration with 6 disks: cWmRd@cWmRd@
READ:	639 MiB/sec	588 MiB/sec	= 614 MiB/sec avg
WRITE:	620 MiB/sec	676 MiB/sec	= 648 MiB/sec avg

Now testing RAIDZ configuration with 4 disks: cWmRd@cWmRd@
READ:	313 MiB/sec	329 MiB/sec	= 321 MiB/sec avg
WRITE:	276 MiB/sec	235 MiB/sec	= 255 MiB/sec avg

Now testing RAIDZ configuration with 5 disks: cWmRd@cWmRd@
READ:	403 MiB/sec	381 MiB/sec	= 392 MiB/sec avg
WRITE:	352 MiB/sec	387 MiB/sec	= 370 MiB/sec avg

Now testing RAIDZ configuration with 6 disks: cWmRd@cWmRd@
READ:	466 MiB/sec	448 MiB/sec	= 457 MiB/sec avg
WRITE:	472 MiB/sec	476 MiB/sec	= 474 MiB/sec avg

Now testing RAIDZ2 configuration with 4 disks: cWmRd@cWmRd@
READ:	236 MiB/sec	230 MiB/sec	= 233 MiB/sec avg
WRITE:	192 MiB/sec	174 MiB/sec	= 183 MiB/sec avg

Now testing RAIDZ2 configuration with 5 disks: cWmRd@cWmRd@
READ:	317 MiB/sec	321 MiB/sec	= 319 MiB/sec avg
WRITE:	286 MiB/sec	247 MiB/sec	= 267 MiB/sec avg

Now testing RAIDZ2 configuration with 6 disks: cWmRd@cWmRd@
READ:	353 MiB/sec	352 MiB/sec	= 353 MiB/sec avg
WRITE:	372 MiB/sec	335 MiB/sec	= 353 MiB/sec avg

Now testing RAID1 configuration with 4 disks: cWmRd@cWmRd@
READ:	289 MiB/sec	288 MiB/sec	= 288 MiB/sec avg
WRITE:	107 MiB/sec	97 MiB/sec	= 102 MiB/sec avg

Now testing RAID1 configuration with 5 disks: cWmRd@cWmRd@
READ:	410 MiB/sec	420 MiB/sec	= 415 MiB/sec avg
WRITE:	109 MiB/sec	93 MiB/sec	= 101 MiB/sec avg

Now testing RAID1 configuration with 6 disks: cWmRd@cWmRd@
READ:	455 MiB/sec	447 MiB/sec	= 451 MiB/sec avg
WRITE:	104 MiB/sec	104 MiB/sec	= 104 MiB/sec avg

Now testing RAID1+0 configuration with 4 disks: cWmRd@cWmRd@
READ:	334 MiB/sec	337 MiB/sec	= 336 MiB/sec avg
WRITE:	214 MiB/sec	221 MiB/sec	= 218 MiB/sec avg

Now testing RAID1+0 configuration with 6 disks: cWmRd@cWmRd@
READ:	480 MiB/sec	468 MiB/sec	= 474 MiB/sec avg
WRITE:	325 MiB/sec	325 MiB/sec	= 325 MiB/sec avg

And with 4k override:
Code:
ZFSGURU-benchmark, version 1
Test size: 16.000 gigabytes (GiB)
Test rounds: 2
Cooldown period: 2 seconds
Sector size override: 4096 bytes
Number of disks: 6 disks
disk 1: label/0.nop
disk 2: label/1.nop
disk 3: label/2.nop
disk 4: label/3.nop
disk 5: label/4.nop
disk 6: label/5.nop

* Test Settings: TS16; TR2; SECT4096; 
* Tuning: none
* Stopping background processes: sendmail, moused, syslogd and cron
* Stopping Samba service

Now testing RAID0 configuration with 4 disks: cWmRd@cWmRd@
READ:	402 MiB/sec	399 MiB/sec	= 401 MiB/sec avg
WRITE:	462 MiB/sec	451 MiB/sec	= 457 MiB/sec avg

Now testing RAID0 configuration with 5 disks: cWmRd@cWmRd@
READ:	516 MiB/sec	513 MiB/sec	= 514 MiB/sec avg
WRITE:	545 MiB/sec	532 MiB/sec	= 539 MiB/sec avg

Now testing RAID0 configuration with 6 disks: cWmRd@cWmRd@
READ:	589 MiB/sec	587 MiB/sec	= 588 MiB/sec avg
WRITE:	683 MiB/sec	661 MiB/sec	= 672 MiB/sec avg

Now testing RAIDZ configuration with 4 disks: cWmRd@cWmRd@
READ:	306 MiB/sec	313 MiB/sec	= 310 MiB/sec avg
WRITE:	299 MiB/sec	293 MiB/sec	= 296 MiB/sec avg

Now testing RAIDZ configuration with 5 disks: cWmRd@cWmRd@
READ:	429 MiB/sec	425 MiB/sec	= 427 MiB/sec avg
WRITE:	425 MiB/sec	420 MiB/sec	= 423 MiB/sec avg

Now testing RAIDZ configuration with 6 disks: cWmRd@cWmRd@
READ:	500 MiB/sec	488 MiB/sec	= 494 MiB/sec avg
WRITE:	501 MiB/sec	487 MiB/sec	= 494 MiB/sec avg

Now testing RAIDZ2 configuration with 4 disks: cWmRd@cWmRd@
READ:	220 MiB/sec	220 MiB/sec	= 220 MiB/sec avg
WRITE:	209 MiB/sec	218 MiB/sec	= 214 MiB/sec avg

Now testing RAIDZ2 configuration with 5 disks: cWmRd@cWmRd@
READ:	301 MiB/sec	305 MiB/sec	= 303 MiB/sec avg
WRITE:	304 MiB/sec	310 MiB/sec	= 307 MiB/sec avg

Now testing RAIDZ2 configuration with 6 disks: cWmRd@cWmRd@
READ:	437 MiB/sec	429 MiB/sec	= 433 MiB/sec avg
WRITE:	409 MiB/sec	416 MiB/sec	= 413 MiB/sec avg

Now testing RAID1 configuration with 4 disks: cWmRd@cWmRd@
READ:	290 MiB/sec	274 MiB/sec	= 282 MiB/sec avg
WRITE:	114 MiB/sec	115 MiB/sec	= 114 MiB/sec avg

Now testing RAID1 configuration with 5 disks: cWmRd@cWmRd@
READ:	409 MiB/sec	401 MiB/sec	= 405 MiB/sec avg
WRITE:	104 MiB/sec	116 MiB/sec	= 110 MiB/sec avg

Now testing RAID1 configuration with 6 disks: cWmRd@cWmRd@
READ:	443 MiB/sec	426 MiB/sec	= 435 MiB/sec avg
WRITE:	117 MiB/sec	111 MiB/sec	= 114 MiB/sec avg

Now testing RAID1+0 configuration with 4 disks: cWmRd@cWmRd@
READ:	326 MiB/sec	312 MiB/sec	= 319 MiB/sec avg
WRITE:	235 MiB/sec	234 MiB/sec	= 234 MiB/sec avg

Now testing RAID1+0 configuration with 6 disks: cWmRd@cWmRd@
READ:	445 MiB/sec	456 MiB/sec	= 450 MiB/sec avg
WRITE:	344 MiB/sec	354 MiB/sec	= 349 MiB/sec avg
 
Very consistent benchmarks; considering putting up the images somewhere on a free host. :)
 
Hardware:
- Intel Pentium G6950 (dualcore, 2.8 GHz, LGA1156)
- Intel Q57 Express
- 1 GB DDR3-1333 ECC
- 1x WD/HP 250 GB system drive
- 3x Samsung F4EG HD204UI

Software:
- FreeBSD 8.1-RELEASE AMD64

3 disks in RAID-Z1 without 4k-gnop:
WRITE: 60 MB/s
READ: 160 MB/s

3 disks in RAID-Z1 with 4k-gnop (gnop create -S 4096 /dev/adX):
WRITE: 100 MB/s
READ: 160 MB/s

But when the gnop-layer disappears after reboot the write-speed is back to 60 MB/s. I have seen people saying it is only necessary to enable gnop when the zpool is created, but here it seems necessary to have it all the time. How do I do that? Or is it something else I can do instead?
 
The firmware issue on F4 is indeed a nasty one; good that ZFS at least detects this kind of corruption, and repairs it on the spot.

Data corruption on HDDs is very bad, but Samsung did release a firmware fix within days of this incident, which is commendable. I can remember firmware issues from Seagate that took months to fix.

Obviously the Samsung issue is an isolated case. However, with the coming of 4K drives and their eventual native exposure to the operating system, issues like "bit rot" can be addressed within the hard drive itself due to much more robust ECC.

With this in mind, does this take away some of the value of ZFS? Obviously it has other features such as a unified filesystem and volume manager, which is obviously more elegant than two separate sets of tools, as well as a robust software RAID implementation, but for me ZFS's main selling point is its data integrity.

Will 4K sector drives take away some of that gloss, or can ZFS's data integrity mechanisms compensate for bad controllers and bad cables too?
 
the 4K drives improved ECC is for BER not bit rot, and is no substitute to ZFS's checksumming.
It is a required improvement due to the fact that bit error rates (BER) get worse with each increased miniaturization. It merely moves the levels of BER from "completely unacceptable, like 2TB drives with 512b internal sectors" to "barely acceptable, like drives from several years ago".
Furthermore, exposing them to the OS directly has 2 advantages:
1. Faster writes.
2. allows 32bit controller a max of 16TB drive rather then a max of 2TB. (64bit drive controllers exist already, which allow significantly higher max drive sizes).

Neither of those is related to ECC, BER, or bit rot.
 
Back
Top