pfsense RRD graphs suck after 2.4 upgrade

OFaceSIG

2[H]4U
Joined
Aug 31, 2009
Messages
4,034
So I recently built a new pfsense box and went from 2.3.x in 32-bit to 2.4.x with 64-bit. Holy crap what happened to the awesome RRD graphs?

Everything else is awesomesauce in 2.4 except the graphs! What happened?

Anyone else feel this way post 2.4 pfsense?
 
Enabling graphs in 2.4.3 started causing errors in the logs for me. Haven't had a chance to look yet, so they're turned off for now. Looking forward to 2.4.4 with all the free Gold goodies included.
 
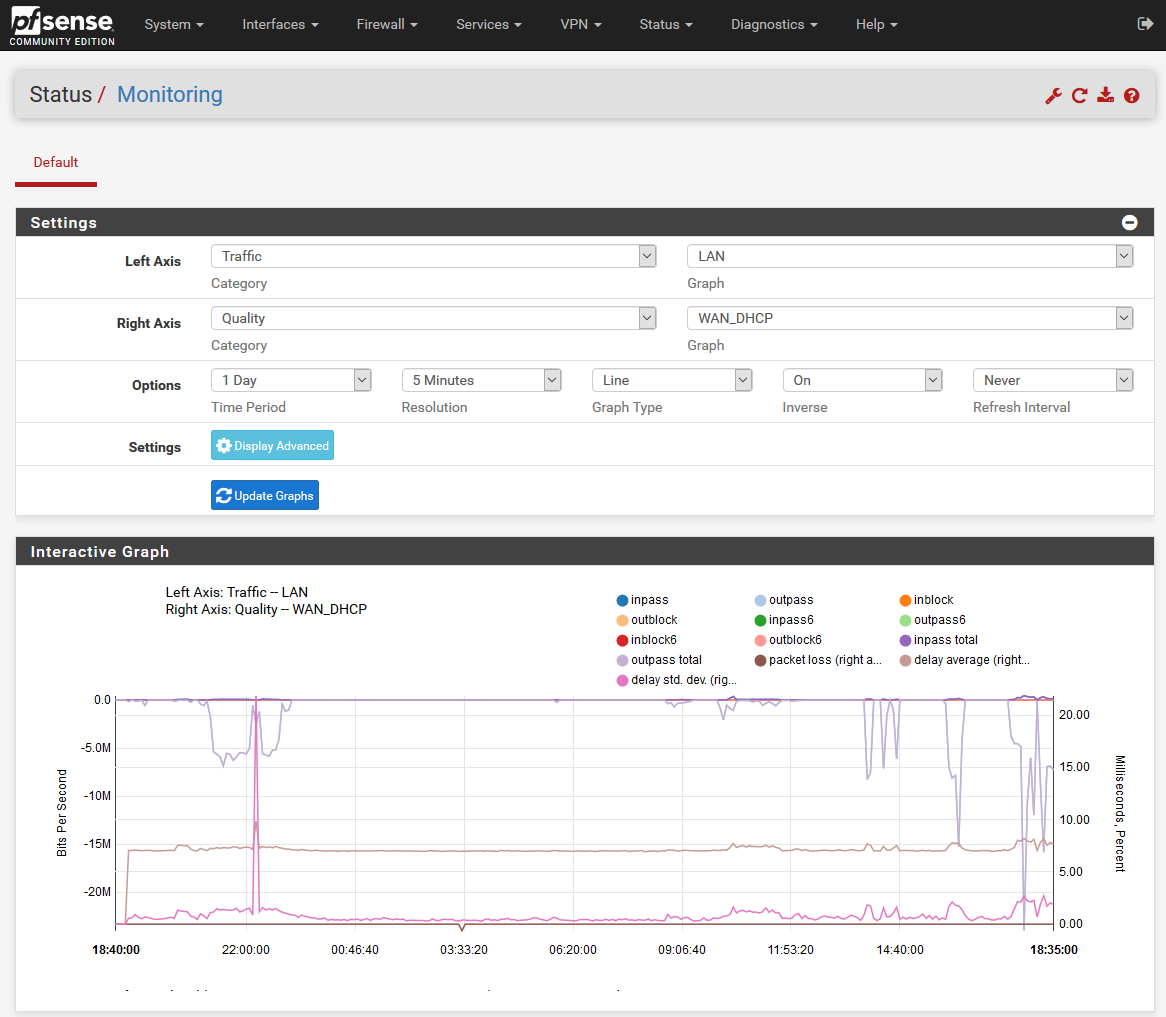
For a minute I was wondering the same thing when I had upgraded, but then I figured out where they were hidden. You need to open up status > monitoring. By default all you'll see is CPU graph there. The magic trick that I don't understand why they decided to hide, is that you need to click on the wrench labeled "settings". It's located in the same bar that the "Status / Monitoring" header is. After you click that wrench a huge configuration window appears. Then you can click on the drop down for category and pick one, then pick the relevant info for the graph. Click update graphs and you'll see everything you could before and I think a bit more.

monitoring graph.PNG
 
Yep they do suck. I kinda got over it but I do miss them. I don't know WTH they were thinking there. Old ones were way better. They are also harder to get to, it's less obvious than before. you would think it would be under "Traffic graphs" but nope. Monitoring.
 
This is a large reason why I have zabbix grab all the data and I slice up graphs on my own :)
 
This is a large reason why I have zabbix grab all the data and I slice up graphs on my own :)

I'm not hardcore enough. I'm just running all the prepackaged shit like squid filter, clamAV.
 
Currently trialing Untangle- and just attempted to use OPNsense.

My use case is a transparent bridge- needs to be able to do IPS along side QoS, which OPNsense documentation claims is not possible.

I'd thought I'd found a similar reference for pfSense, but I can't find it now- anyone know if this is possible with pfSense?

[graphs are cool BTW]
 
How do you get the raw data? I eventually want to do something like that too.
pFsense has a zabbix agent package you can install, then you just grab the data however you want. I also installed Traffic Totals package to capture interface traffic totals, which I then capture with a simple bash script

Code:
#!/bin/bash

i=$(vnstat --oneline | awk -F\; '{ print $11 }')
bandwidth_number=$(echo $i | awk '{ print $1 }')
bandwidth_unit=$(echo $i | awk '{ print $2 }')
case "$bandwidth_unit" in
KiB)    bandwidth_number_MB=$(echo "$bandwidth_number/1024" | bc)
    ;;
MiB)    bandwidth_number_MB=$bandwidth_number
    ;;
GiB)     bandwidth_number_MB=$(echo "$bandwidth_number*1024" | bc)
    ;;
TiB)    bandwidth_number_MB=$(echo "$bandwidth_number*1024*1024" | bc)
    ;;
esac
echo $bandwidth_number_MB

Then in the zabbix web UI, you basically tell it to run that script every x minutes and pull the data in and graph it. I also grab other data like CPU temp, disk usage, and some firewall info as well.
 
Oh right I always forget that pfsense has a SSH interface. I have a custom monitoring system so I should be able to pull the data that way then. Not sure if my agent would actually compile on it but as long as I can get the raw data somehow I can write the required scripts on the monitoring server and go from there.
 
Back
Top