Negative Decibel
2[H]4U
- Joined
- Dec 13, 2005
- Messages
- 3,588
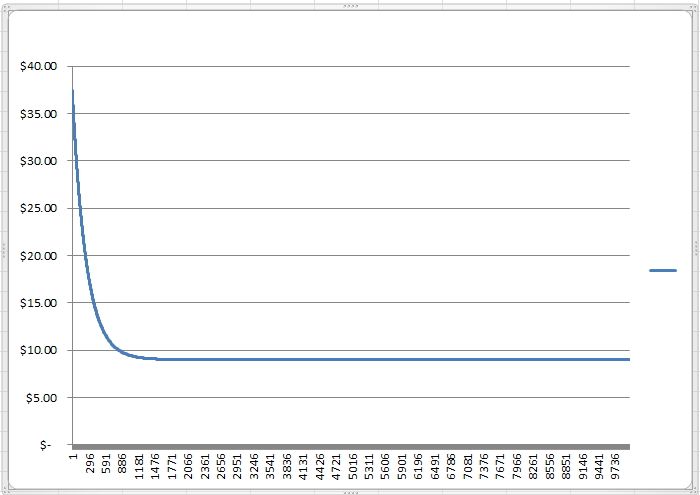
So, I have a simple 2 column worksheet for prices of number of licences:
Column A is the number of licences, and Column B has prices. Simple.
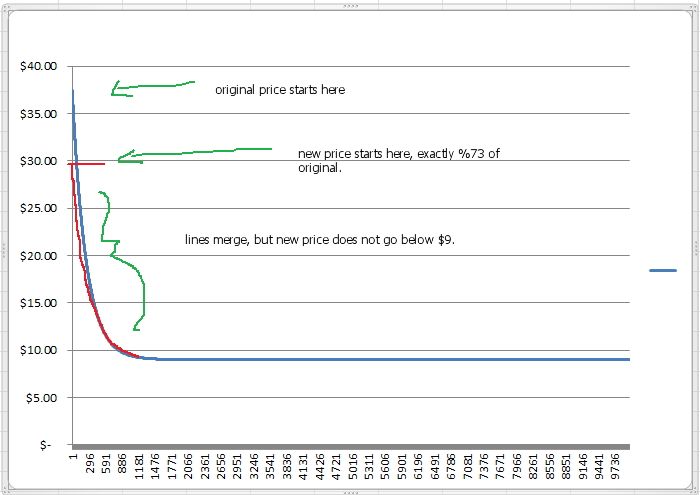
Column A starts at 1, and goes to 10,000. The prices in Column B start at $37.46 and gradually go down to $9 (around line 2100 or so. and yeah the rest from 2100-10000 is only $9.
Here's what I'm trying to do. They want new prices that are lower, but end about the same @ $9. The first cell in Column C is B3*.73, or $27.35...
It seems so simple, but I'm having a hard time on this one.
Column A is the number of licences, and Column B has prices. Simple.
Column A starts at 1, and goes to 10,000. The prices in Column B start at $37.46 and gradually go down to $9 (around line 2100 or so. and yeah the rest from 2100-10000 is only $9.
Here's what I'm trying to do. They want new prices that are lower, but end about the same @ $9. The first cell in Column C is B3*.73, or $27.35...
It seems so simple, but I'm having a hard time on this one.