- Joined
- May 18, 1997
- Messages
- 55,598
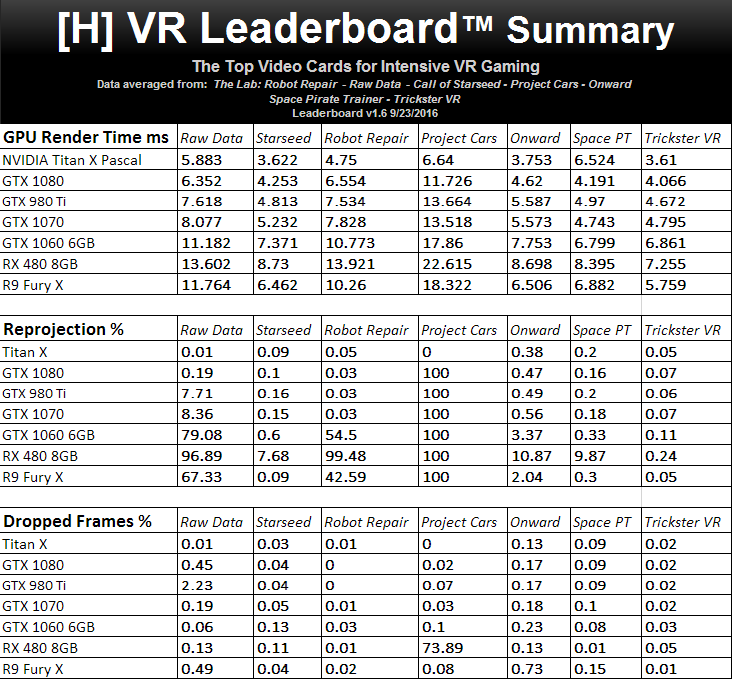
Been listening to you guys and thinking that maybe an addition such as this might be welcomed? Feedback please.


Follow along with the video below to see how to install our site as a web app on your home screen.
Note: This feature may not be available in some browsers.

Also how's this going to look after 10 more reviews?
Likely just using results from the most relevant games of the time just like normal GPU reviews i'd imagine.Also how's this going to look after 10 more reviews?
Well I guess if price were the only consideration, but it is not.You can get the Fury X for less then $400 pretty consistently now and even a Fury for $309. So the standings maybe should change a little. Still looking at the 1060 and FuryX - they are not that much different in performance, one winning over the other and visa versa.
Fury X - Newegg.com
Nope, all are at apples to apples for the chart. I will go back and make sure however that the data is correct.There is an error in the Render Time numbers in that chart for the Titan X Pascal in Space PT. You used 1.4x SS numbers, while the other GPUs are using 1.0x SS numbers. For a simple comparison chart like this to make sense, everything should be apples to apples.
No they have not done that in the last month. AMD wanted me to have the discussion with Scott Wasson, and I told them that I thought that was a conflict of interest since he owned TechReport.com and worked for AMD as well. They told me he "works for AMD." I asked if I could have NVIDIA join me on the call as well since conflict of interest was not an issue. Have not heard back from AMD. But I have followed up twice to forward the conversation without Scott. Seems no one else at AMD is versed to talk to us on VR except the owner of a competing tech site that does not cover VR performance.I wonder if AMD ever got back with you on their VR performance or lack thereof?
Nope.Not sure how much work this would be, but is it possible to have a table like the one above but have it be "active" on the site? Like, be able to sort values by game column, for instance?

Yes, I understand what you are saying. However that does not change the facts. As we test more games it will become statistically insignificant.Kyle, this is what I was talking about. Project cars is an oddity in that only the Titan "did well". So, it skews the "average" numbers in your original summary chart. It would be like putting the original Crisis, at the time, in an average with other games...it would make all the cards look like shit when it was really just that "one game" making things look bad.
View attachment 8238
Thanks for you input.But as you test more games drivers/programs get updated/patched and thus old data may not be correct. That one odd duck can really screw with the results especially with reprojection. The easy way to handle "odd data" is to throw out the high and low values when displaying averages for small data sample sets.