Cat (Bulldozer) out of the bag! Review here!

mzs_biteme

[H]ard|Gawd
Joined
Nov 7, 2001
Messages
1,595
From DH.com

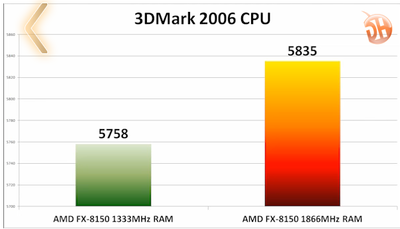
Not in English, but you'll get the idea...

I stole the important stuff...;)

2011-10-09_174346.png


2011-10-09_174520.png


2011-10-09_174635.png


2011-10-09_174642.png


2011-10-09_174706.png


2011-10-09_174723.png


2011-10-09_174749.png


2011-10-09_174817.png


2011-10-09_174836.png


2011-10-09_174915.png


2011-10-09_175015.png


2011-10-09_175043.png


2011-10-09_175158.png


2011-10-09_175234.png


2011-10-09_175243.png


2011-10-09_175300.png


2011-10-09_175313.png


2011-10-09_175322.png


2011-10-09_175344.png


2011-10-09_175415.png


2011-10-09_175440.png


2011-10-09_175516.png


2011-10-09_175536.png


2011-10-09_175631.png


2011-10-09_175649.png


2011-10-09_175705.png


2011-10-09_175853.png


2011-10-09_175909.png


2011-10-09_180005.png


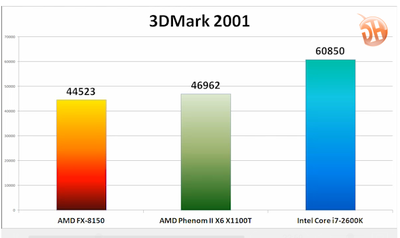
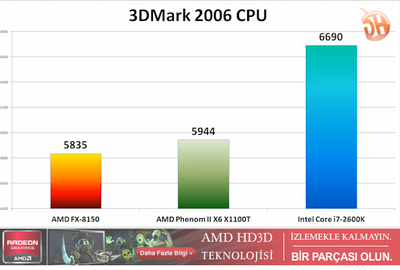
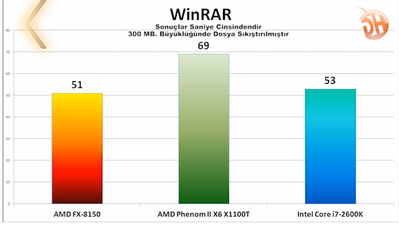
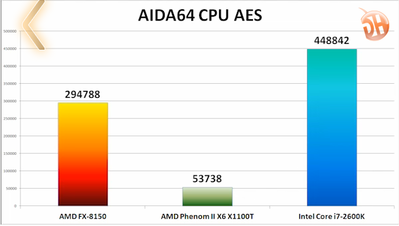
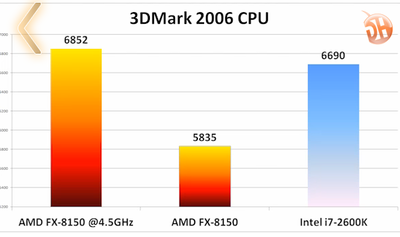
Wheew.... Bottom line: ALL LEAKS WERE mostly TRUE!!!! (But I'll wait till 12th...;) )
 
Possible benchies ill give it that.....however it is DH and their info has proven unreliable time and time again
 
Wow, could that site make its bias any more obvious? I'm not favoring one brand or the other, but disingenuous reporting pisses me off. And there's a pretty strong correlation between whether or not AMD or Intel wins a specific benchmark, and whether or not they decided to start the graph's Y-axis at 0. :)
 
Another one. Yawn. I'll wait a whopping whole week for [H] to get the real benchies posted.

That is, IF it's actually launching then...
 
Yea, I'm pretty much brand agnostic but that's just a stupid benchmark with some pretty obvious favoritism (notice how some graphs start at y = 0 and some don't).
 
Yea, I'm pretty much brand agnostic but that's just a stupid benchmark with some pretty obvious favoritism (notice how some graphs start at y = 0 and some don't).

Clue me in please... How does that change ANYTHING in the graphs posted...???:rolleyes:
 
Clue me in please... How does that change ANYTHING in the graphs posted...???:rolleyes:

i'm guessing they're pointing out that presentation-wise, it makes the graphs look shitty. that's all i get out of it anyway. the framerate ones especially.
 
man those numbers are all over the place.. makes me really wonder if theres going to be some windows optimization update for bulldozer or something.
 
Clue me in please... How does that change ANYTHING in the graphs posted...???:rolleyes:


what hes saying is look at the difference between the numbers.. for example look at the batman AA graphs. where it looks like intel has this ungodly advantage over the 8150.. but if you really look at it theres only a 3 fps difference at 1920x1080, and 6fps difference at 1680x1050.. it just looks sloppy. its the type of crap you expect to see in a marketing slide, not a review site.
 
Actually, it only really gets spanked in synthetic benchmarks. Who cares about synthetics.

Games like Civ 5 it beats 2600k, AES instruction addition finally, not as fast as 2600k but it's much much faster than Thuban...

Dunno these benches aren't that bad honestly. Also what's with the graph scaling? 20 milliseconds is like 80% of the graph.

Still I don't trust DH know how to benchmark anything even if they had the real CPU..
 
what hes saying is look at the difference between the numbers.. for example look at the batman AA graphs. where it looks like intel has this ungodly advantage over the 8150.. but if you really look at it theres only a 3 fps difference at 1920x1080, and 6fps difference at 1680x1050.. it just looks sloppy. its the type of crap you expect to see in a marketing slide, not a review site.

Ahh... You looked at the pretty colored bars instead of hard numbers... :cool::D
 
Yea, I'm pretty much brand agnostic but that's just a stupid benchmark with some pretty obvious favoritism (notice how some graphs start at y = 0 and some don't).

whether results are genuine or not, reviews that display results in graphs not to scale is one of my pet hates.

there some situations were truncating graphs is necessary (large differential between data points), however in these cases there should be a squiggly line (forgotten name) on axis where scale is out.
 
BD is on point or better than the 2600k in 3DMark 11, current games, and un-zipping files. Close enough for me on CB 11.5 also (according to DH lol).

Yet I want to see IN-DEPTH CPU benchmarks with different graphics cards, and where is the FX 6 core scores @ or the Quad FX. What are the prices? Stuff like this in reviews screams of half truths or bs they have no NDA or Embargo info straight from AMD they are full of it IMO. I still haven't made up my mind because these reviews all are very limited.

In all these reviews though the SB chips perform steller in Pi and 3D mark 01/06 though. But do people really care about that shit? it's almost 2012 that 3d mark benchmark is about 11 years old people WTF why run an 11 year old benchmark, why not break out Quake 3 while your @ it DonaimHaiber? Does Intel want you posting 3DMark 2001 scores? WHy?

Next!
 
My impression of the AMD fanboys, *sticks fingers in ears* "LALALALA I CAN'T HEAR YOU LALALALALALALALA".
 
Replys saying what exactly this final production model cpu can actually do on production bios firmware etc. are ridiculous.

We don't have a reliable benchmark suite that has been done on the retail cpu.

No one has a retail cpu that is allowed to disclose the information.

What it is faster at and isn't is unknown.

Do I believe the post. No. Is is another hoax? Probably.

Is it possible that the new AMD cpu is weaker then the 2600K. Yes.

Is it possible that its stronger then the 2600k in most ways? Yes.

Do we know for SURE. No.

Move along.
 
Wow, could that site make its bias any more obvious? I'm not favoring one brand or the other, but disingenuous reporting pisses me off. And there's a pretty strong correlation between whether or not AMD or Intel wins a specific benchmark, and whether or not they decided to start the graph's Y-axis at 0. :)

Seriously. Especially the "3D Mark 2006 Standart". It looks like the 2600K beats the 8150 by like 3X, but in reality the difference is only about 0.4%. That's right, less than 1%. :rolleyes:
 
lol, why are the graphs so lopsided? In a lot its a small difference but the bars are miles apart.
 
I'm really happy with these results. Close to the 2600k at stock yet a lot cheaper.
 
My impression of an intel fanboys impression of an AMD fanboy:


My impression of the AMD fanboys, *sticks fingers in ears* "LALALALA I CAN'T HEAR YOU LALALALALALALALA".


seriously, did you look at the graphs? The scaling is all over the place to show bigger gaps between performance rather than the hard numbers
 
You know I just noticed this. In games that don''t use more than two cores, Bulldozer keeps up with Sandy Bridge at a lower resolution. But yet it gets destroyed in synthetics where the module design should scale better than hyper threading.
 
I wont believe any benchmark unless it meets the following requirements

1. AMD has officially released their FX series of processors
2. Raja must confirm that the bios and AGESA are the latest
3. All benchmarks must be performed by Chew
4. JFAMD must be in the same room while the benchmarks are being performed
5. The processor must be liquid cooled with the blood of fallen AMD processor engineers
6. Any result that shows an Intel processor as performing better must be thrown out as invalid
 
you can cry "intel fanboi !!!" from the way the axes are presented.

but the actual numbers are still posted in the graphs, and they are not flattering for BD any way you look at it.
 
I am not defending AMD's product, trying to explain away the hard numbers, or rationalizing my brand loyalty. (I've been using a P67 setup for 6 months now, anyway.)

The fact is, intellectual dishonesty should be identified and ridiculed early, and often, and at every opportunity.
 
Sat through that whole video, and nowhere did DH even list the specs of the three systems. Only that they had a FX-8150, 1100T and a 2600K, MSI 990FX and Z68 boards.

Any review site worth more than a bent penny would show the configurations they used.

Also, if DH never signed a NDA, why would they block out anything on the chip? AMD knows exactly who they sent chips out to, and it wouldn't be hard for them to find out.
 
The scale on some of those graphs is horrendous. Makes, the BD look like crap even though they are pretty much even.
 
Wow this is bad but it's not like we didn't know this was coming. I mean it's a new architectural change to phenom and has more cores, but thats about it. Its' actually alittle worse in instances.
 
I guess those leaked benchmarks were true, Bulldozer is a failure of a CPU, its like the original Phenom's. If it loses to the i5 2500K, something is wrong.
 
A bit of good news for those wanting/waiting for BD... Price vs Performance is where BD is shining... But we already knew that was gonna be the case when we heard the news of their pricing scheme almost two months ago...
 
I guess those leaked benchmarks were true, Bulldozer is a failure of a CPU, its like the original Phenom's. If it loses to the i5 2500K, something is wrong.

But it's not losing to the 2500k in these benchmarks, it's losing to the i7 2600k and just barely in the actual game benchmarks. I call that a win.
 
Back
Top